Chart
graphical representation of data
graphical representation of data | |||||
| Upload media | |||||
| Subclass of | |||||
|---|---|---|---|---|---|
| Different from | |||||
| |||||
English: A chart is a graphic depicting the relationship between two or more variables with a discrete or continuous value range, used, for instance, in visualising scientific data. Charts are often used to make it easier to understand large quantities of data and the relationship between different parts of the data.
History edit
Medieval charts edit
-
 Line graph with Planetary Movements, 10th c.
 -
 Tree of Jesse, 1175
 -
 Family tree, late 12th c.
 -
 Classification chart of knowledge, late 13th c.
 -
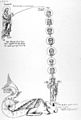
 Tree diagram of knowledge, ca 1305.
 -
 Proto-Bar chart, 1350/1505


_using_A_porphyrii_structure.png)

18th century edit
-
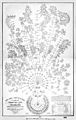
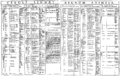 Classification chart, Table of the Animal Kingdom by Carl von Linné, 1735.
 -
 Classification chart, Table of plants by Carl von Linné, 1736
 -
 Timeline, Joseph Priestley's Chart of Biography, 1765.
 -
 Timeline, Priestley's A New Chart of History, 1769.
 -
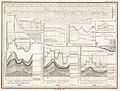
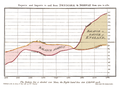 Line chart by William Playfair, 1786
 -
 Bar chart by William Playfair, 1786
.png)


19th century edit
- First part
-
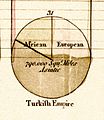
 Pie chart by William Playfair, 1801
 -
 Pie chart by William Playfair, 1801
 -
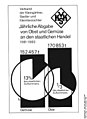
 Bar chart by William Playfair, 1822
 -
 Comparison diagram, 1922
 -
 Comparison diagram, 1923
 -
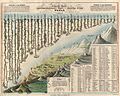
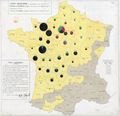
 Choropleth map by Charles Dupin, 1826
 -
 Comparison diagram, 1927
 -
 Comparison chart, 1938


- Second part
-
 Organizational chart, 1855
 -
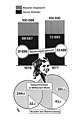
 Minard's map using pie charts, 1858
 -
 Polar area diagram, 1858
 -
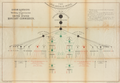
 Organizational chart,1862
 -
 Organizational chart,1863
 -
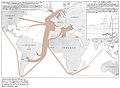 Flow map by Minard, 1864
 -
 Cartogram by Minard, 1865
 -
 Charles Minard's flow diagram, 1869
 -
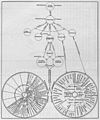
 Radar charts, 1889
 -
 Cartogram, 1889
 -
 Cartogram, 1889
 -
 Proto flow chart, 1893


20th century edit
- First part
-
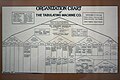
 Organizational chart, 1905
 -
 Organizational chart, 1917


- Second part
-
 Organizational chart, 1952
 -
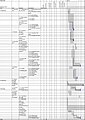
 Gantt chart, 1967
 -
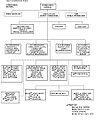
 N2 Chart, 1977-86
 -
 1974
1974 -
 1974
1974 -
 1974
1974 -
 1978
1978 -
 1983
1983 -
 1984
1984 -
 1984
1984 -
 1987
1987


21st century edit
-
 Flow Process Chart, 1921/1948/2008
 -
 Gantt chart building a SSV. 2013


Type of charts edit
Quantitative or statistical charts, general types edit
- See also Category:Statistical charts


Quantitative or statistical charts, specific types edit


.svg)


Qualitative Charts, general types edit
-

-
-
 Timeline chart
 -


Qualitative Charts, specific types edit


Use of charts edit
20th century edit
-
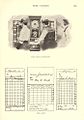 Time clock and time charts, 1909
 -
 Planning department bulletin board, 1911.
 -
 Family counselor is examining wall chart, 1942
 -
 Planning- meeting, 1952 (1)
 -
 Planning- meeting, 1952 (2)
 -
 Planning- meeting, 1952 (3)
 -
 Updating the performance chart, 1953
 -
 Collective planning, 1956


21st century edit
-
 Showing a diagram of the flight path of the aircraft that crashed into the Pentagon during the attacks on Sept. 11, 2001, 2006
 -
 Updating status board in Primary Flight Control, 2004
 -
 Staff meeting, 2008
 -
 Chapters meeting, 2009
 -
 Planboard planning, 2010
 -
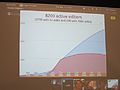
 Metrics meeting, 2011
 -
 Educational outreach presentation, 2012
 -
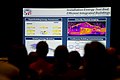 Sun Shot Presentation, 2012
 -
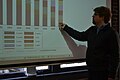
 Planning Meeting, 2013
 -
 November Metrics Meeting, 2013 (1)
 -
 November Metrics Meeting, 2013 (2)
 -
 November Metrics Meeting, 2013 (3)
 -
 Edinburgh Collab meeting, 2014
 -
 All-staff meeting, 2015

.jpg)


.jpg)
.jpg)


