Category:Agriculture statistics
Subcategories
This category has the following 9 subcategories, out of 9 total.
Media in category "Agriculture statistics"
The following 108 files are in this category, out of 108 total.
-
 10 Principales cultures 2007.svg 1,335 × 866; 106 KB
-
 Agri-yields-uk (OWID 0033).png 850 × 600; 66 KB
-
 Agricultural-land-area-by-farm-size (OWID 0029).png 850 × 600; 73 KB
-
 Agricultural-output-dollars (OWID 0026).png 850 × 600; 51 KB
-
 Agriculture-decoupling-productivity (OWID 0021).png 850 × 600; 118 KB
-
 Agriculture-share-gdp (OWID 0017).png 850 × 600; 99 KB
-
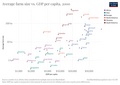
 Agriculture-value-added-per-worker-vs-gdp-per-capita (OWID 0016).png 850 × 600; 91 KB
-
 Anbau Gv-Mais 2016.png 600 × 600; 37 KB
-
 Annual report of the Secretary of the Board of Agriculture (1894) (19361007752).jpg 2,848 × 1,070; 374 KB
-
 Area-per-tonne-oil (OWID 0088).png 850 × 600; 61 KB
-
 Average corn yields in the United States, 1866-2014, OWID.svg 850 × 600; 12 KB
-
 Average-farm-size (OWID 0085).png 850 × 600; 93 KB
-
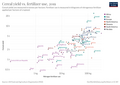
 Average-farm-size-vs-gdp (OWID 0084).png 850 × 600; 75 KB
-
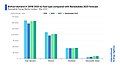 Biofuel demand in 2019-2021 by fuel type compared with Renewables 2021 forecast.jpg 1,920 × 1,080; 107 KB
-
 Cereal-crop-yield-vs-fertilizer-application (OWID 0112).png 850 × 600; 84 KB
-
 Cereal-production (OWID 0111).png 850 × 600; 103 KB
-
 Cereal-yields-uk (OWID 0170).png 850 × 600; 110 KB
-
 Cereal-yields-vs-tractor-inputs-in-agriculture (OWID 0169).png 850 × 600; 121 KB
-
 Change-calories-climate-yield (OWID 0166).png 850 × 600; 107 KB
-
 Change-of-cereal-yield-vs-land-used (OWID 0155).png 850 × 600; 69 KB
-
 Corn-production-land-us (OWID 0242).png 850 × 600; 73 KB
-

-
 Crop yields of cereals and pulses, OWID.svg 850 × 600; 13 KB
-
 Crop-allocation-farm-size (OWID 0229).png 850 × 600; 88 KB
-
 Dietary-land-use-vs-gdp-per-capita (OWID 0286).png 850 × 600; 113 KB
-
 Drivers-of-forest-loss-in-the-Brazilean-Amazon.png 2,763 × 854; 175 KB
-
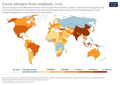 Excess-nitrogen (OWID 0343).png 850 × 600; 121 KB
-
 Excess-nitrogen-per-hectare (OWID 0342).png 850 × 600; 119 KB
-
 Excess-phosphorous (OWID 0340).png 850 × 600; 117 KB
-
 Excess-phosphorous-per-hectare (OWID 0341).png 850 × 600; 110 KB
-
 Farm-size-change (OWID 0452).png 850 × 600; 97 KB
-
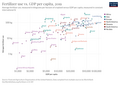 Fertilizer-consumption-per-hectare-vs-gdp-per-capita (OWID 0454).png 850 × 600; 91 KB
-
 Fertilizer-consumption-usda (OWID 0449).png 850 × 600; 48 KB
-
 Fertilizer-exports-russia-ukraine (OWID 0451).png 850 × 600; 44 KB
-
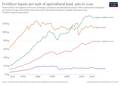 Fertilizer-inputs-per-land (OWID 0450).png 850 × 600; 83 KB
-
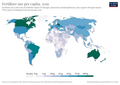 Fertilizer-per-capita (OWID 0447).png 850 × 600; 103 KB
-
 Fertilizer-per-hectare (OWID 0445).png 850 × 600; 57 KB
-
 Fertilizer-use-nutrient (OWID 0443).png 850 × 600; 61 KB
-
 Global-agri-productivity-growth (OWID 0473).png 850 × 600; 82 KB
-
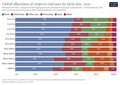
 Global-crop-production-by-farm-size (OWID 0462).png 850 × 600; 74 KB
-
 Groundnuts-yield (OWID 0519).png 850 × 600; 89 KB
-
 Gv-mais-eu.PNG 713 × 528; 18 KB
-
 Habitat-loss-25-species (OWID 0517).png 850 × 600; 107 KB
-
 HST2 FIG1 aantal bedrijven en gem opp.png 1,473 × 604; 48 KB
-
 HST2 FIG42 VLTB ecoefficientie.png 1,341 × 1,397; 123 KB
-
 Impact-climate-maize-percentage (OWID 0499).png 850 × 600; 113 KB
-
 Index-of-cereal-production-yield-and-land-use (OWID 0493).png 850 × 600; 75 KB
-
 Insecticide use, OWID.svg 850 × 600; 9 KB
-
 Land Equivalent Ratio of polyculture vs monoculture.png 2,500 × 1,500; 805 KB
-
 Land Equivalent Ratio xcf file.xcf 2,500 × 1,500; 5.98 MB
-
 Land equivalent ratio.png 2,500 × 1,500; 756 KB
-
 Land use per 100 kilocalories by food and production type, OWID.svg 850 × 600; 16 KB
-
 Land use per unit protein by food and production system, OWID.svg 850 × 600; 13 KB
-
 Land-sparing-by-crop (OWID 0593).png 850 × 600; 79 KB
-
 Land-use-vs-yield-change-in-cereal-production (OWID 0581).png 850 × 600; 92 KB
-
 Lettuce-yields (OWID 0574).png 850 × 600; 92 KB
-
 Long-term agricultural yields in the United Kingdom, OWID.svg 850 × 600; 29 KB
-
 Long-term cereal yields in the United Kingdom, OWID.svg 850 × 600; 19 KB
-
 Long-term wheat yields in Europe, OWID.svg 850 × 600; 20 KB
-
 Maize-attainable-yield (OWID 0557).png 850 × 600; 109 KB
-
 Maize-yield-gap (OWID 0552).png 850 × 600; 105 KB
-
 Millet-yield (OWID 0658).png 850 × 600; 88 KB
-
 Nitrogen-inputs-per-hectare (OWID 0624).png 850 × 600; 108 KB
-
 Nitrogen-output-vs-nitrogen-input-to-agriculture (OWID 0622).png 850 × 600; 159 KB
-
 Nitrogen-use-efficiency (OWID 0623).png 850 × 600; 112 KB
-
 Number-farms-size (OWID 0611).png 850 × 600; 78 KB
-
 Number-of-farms (OWID 0733).png 850 × 600; 104 KB
-
 Number-of-people-employed-in-agriculture (OWID 0729).png 850 × 600; 89 KB
-
 Oil-yield-by-crop (OWID 0699).png 850 × 600; 57 KB
-
 Organic agricultural area, OWID.svg 850 × 600; 6 KB
-
 Palm-oil-production (OWID 0682).png 850 × 600; 40 KB
-
 Palm-oil-yields (OWID 0680).png 850 × 600; 85 KB
-
 Pea-production (OWID 0674).png 850 × 600; 93 KB
-
 Pea-yields (OWID 0673).png 850 × 600; 90 KB
-
 Phosphorous-inputs-per-hectare (OWID 0850).png 850 × 600; 108 KB
-
 Rye-production (OWID 0961).png 850 × 600; 92 KB
-
 Rye-yield (OWID 0959).png 850 × 600; 90 KB
-
 Serie storica del grano in India.png 533 × 333; 36 KB
-
 Serie storica del miglio in India.png 534 × 337; 36 KB
-
 Serie storica grano con regressione.png 530 × 316; 28 KB
-
 Serie storica miglio con regressione.png 539 × 320; 27 KB
-
 Sesame-seed-production (OWID 0951).png 850 × 600; 90 KB
-
 Share of agriculture in total employment, OWID.svg 850 × 600; 6 KB
-
 Share-agriculture-smallholder-farms (OWID 0947).png 850 × 600; 98 KB
-
 Share-farms-smallholders (OWID 0909).png 850 × 600; 98 KB
-
 Share-farms-smallholders-vs-gdp (OWID 0912).png 850 × 600; 90 KB
-
 Share-global-excess-nitrogen (OWID 1015).png 850 × 600; 121 KB
-
 Soil-lifespans (OWID 0970).png 850 × 600; 75 KB
-
 Sorghum-yield (OWID 1083).png 850 × 600; 86 KB
-
 Soy-production-yield-area (OWID 1080).png 850 × 600; 63 KB
-
 Soybean-production (OWID 1078).png 850 × 600; 96 KB
-
 Soybean-production-and-use (OWID 1079).png 850 × 600; 66 KB
-
 Sugar-beet-yields (OWID 1069).png 850 × 600; 89 KB
-
 Sunflower-seed-production (OWID 1067).png 850 × 600; 93 KB
-
 Sunflower-seed-yield (OWID 1062).png 850 × 600; 93 KB
-
 Sweet-potato-production (OWID 1058).png 850 × 600; 92 KB
-
 Taula de destinació de tots els cereals consumits.png 847 × 359; 64 KB
-
 Tomato-production (OWID 1042).png 850 × 600; 96 KB
-
 Total-applied-phosphorous-crops (OWID 1035).png 850 × 600; 106 KB
-
 Total-nitrogen-inputs-crops (OWID 1032).png 850 × 600; 108 KB
-
 Tractors per 100 square kilometres of arable land, OWID.svg 850 × 600; 23 KB
-

-
 Verteilung der Weltbevölkerung nach Subsistenztätigkeit.png 1,335 × 908; 97 KB
-
 Wolf (Canis lupus) Populationsdichte.png 1,472 × 1,304; 68 KB
-
 Wolf Angriffe auf Weidetiere Tageszeiten.png 1,190 × 742; 33 KB
-
 Wolf Herdenschutz Frankreich.png 1,190 × 742; 32 KB
-
 Wölfe Schweiz genetische Nachweise.png 1,436 × 912; 36 KB
-
 Yams-production (OWID 1094).png 850 × 600; 86 KB

.png)
.png)
.png)
.png)
.png)
.png)

.png)

.png)
.png)

.png)
.png)
.png)
.png)
.png)
.png)
.png)


.png)
.png)
.png)
.png)
.png)
.png)
.png)
.png)
.png)
.png)
.png)
.png)
.png)
.png)
.png)
.png)
.png)

.png)

.png)
.png)


.png)
.png)
.png)


.png)
.png)
.png)
.png)
.png)
.png)
.png)
.png)
.png)
.png)

.png)
.png)
.png)
.png)
.png)
.png)
.png)


.png)

.png)
.png)
.png)
.png)
.png)
.png)
.png)
.png)
.png)
.png)
.png)
.png)
.png)

.png)
.png)
.png)

.png)

_Populationsdichte.png)


.png)
_(19361007752).jpg)