Category:Demographics of England
overview about the demography of England | |||||
| Upload media | |||||
| Instance of |
| ||||
|---|---|---|---|---|---|
| Subclass of | |||||
| Location | England | ||||
| |||||
Subcategories
This category has the following 2 subcategories, out of 2 total.
L
P
Media in category "Demographics of England"
The following 52 files are in this category, out of 52 total.
-
 01england ethnicity.jpg 747 × 481; 29 KB
-
 07england ethnicity.jpg 651 × 481; 26 KB
-
 All other ethnic groups births.svg 512 × 637; 287 KB
-
 Asian births in England.svg 512 × 637; 153 KB
-
 Badger Salop Population.svg 674 × 470; 67 KB
-
 Birmingham population pyramid 1891.svg 2,811 × 2,167; 17 KB
-
 Birmingham population pyramid 1951.svg 2,811 × 2,167; 17 KB
-
 Birmingham population pyramid 1971.svg 2,811 × 2,167; 17 KB
-
 Birmingham population pyramid 1981.svg 2,811 × 2,167; 17 KB
-
 Birmingham's industry over time.svg 2,332 × 1,561; 15 KB
-
 Births not stating an ethnicity in England and Wales.svg 512 × 637; 286 KB
-
 Black births in England.svg 512 × 637; 286 KB
-
 Borough Fen Population.jpg 591 × 334; 36 KB
-
 Bradford's industry over time.svg 2,323 × 1,576; 24 KB
-
 Brewood Pop.svg 748 × 503; 67 KB
-
 Cratfield population chart.jpg 487 × 295; 14 KB
-
 Cratfield population line graph.jpg 483 × 291; 20 KB
-
 Cullumpton population 1801-2010.png 1,134 × 743; 34 KB
-
 Deprivation in England.png 480 × 289; 10 KB
-
 Districts of England by Other White percent.svg 512 × 622; 5.88 MB
-
 Districts of England Pakistani.svg 512 × 622; 9.67 MB
-
 England abortion percentages mapped across adminstrative districts.svg 512 × 622; 938 KB
-
 England ethnicity estimates 2009.jpg 1,105 × 581; 76 KB
-
 England population pyramid from 2001 to 2020.gif 1,200 × 1,037; 614 KB
-
 English districts by Indian percentage.svg 512 × 622; 8.36 MB
-
 Ethnic demography of Bradford over time.gif 1,200 × 1,066; 486 KB
-
 Ethnic demography of Coventry over time.gif 1,200 × 1,134; 407 KB
-
 Ethnic demography of Leeds over time.gif 1,200 × 1,150; 459 KB
-
 Ethnic demography of Nottingham over time.gif 1,200 × 1,150; 479 KB
-
 Ethnic makeup of England in single year age groups in 2021.svg 3,467 × 2,303; 50 KB
-
 Ethnic makeup of Slough by single year ages in 2021.svg 3,467 × 2,303; 44 KB
-
 Ethnicity in Willisham.jpg 476 × 292; 26 KB
-
 Greater Manchester Population.png 1,143 × 977; 141 KB
-
 Hartlepool Population Chart.jpg 680 × 312; 28 KB
-
 London population pyramid 1861.svg 2,811 × 2,167; 17 KB
-
 London population pyramid 1911.svg 2,811 × 2,167; 18 KB
-
 London population pyramid 1961.svg 2,811 × 2,167; 17 KB
-
 London population pyramid 1971.svg 2,811 × 2,167; 17 KB
-
 London's industry over time.svg 2,654 × 1,786; 23 KB
-
 Mixed births.svg 512 × 637; 286 KB
-
 Parish population Holme St. Cuthbert.jpg 752 × 452; 36 KB
-
 Penkridge Population 1801-1961.svg 952 × 700; 82 KB
-
 Population change in Ivybridge (1911-2011).png 1,018 × 502; 12 KB
-
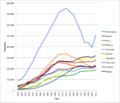
 Population of England over time.svg 2,052 × 1,599; 19 KB
-
 Population pyramid for England using 2011 census data.png 1,134 × 945; 42 KB
-
 Population pyramid of England - 2021.svg 2,341 × 1,718; 30 KB
-
 Population Time Series Graph.jpg 787 × 485; 73 KB
-
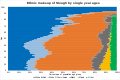
 Religious makeup of England in single year age groups in 2021.svg 3,180 × 2,232; 36 KB
-
 Suicides in England and Wales per 100000 population.svg 2,134 × 1,611; 49 KB
-
 White births in England.svg 512 × 631; 153 KB
-
 White British school children within England.svg 512 × 622; 1,000 KB
-
 White total school children within England.svg 512 × 622; 1.02 MB


.png)


