Category:Economic statistics for Brazil
Subcategories
This category has the following 3 subcategories, out of 3 total.
I
- Inflation graphs of Brazil (15 F)
T
- Treemaps on exports of Brazil (18 F)
Media in category "Economic statistics for Brazil"
The following 24 files are in this category, out of 24 total.
-
 2006Brazilian exports.PNG 1,425 × 625; 61 KB
-
 Aliq efet IRPF09.png 576 × 362; 6 KB
-
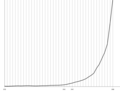
 Automobiles production statistics (1960-).png 6,965 × 4,235; 1.6 MB
-
 Brasil economia.jpg 895 × 979; 210 KB
-
 Brazil Export Treemap.jpg 1,106 × 861; 753 KB
-
 Brazilian GDP growth 1920-1946.png 640 × 486; 19 KB
-
 Brazilian GDP growth 1920-1960.png 640 × 486; 17 KB
-
 Brazilian States by GDP per capita.PNG 528 × 391; 13 KB
-
 Coeficiente de gini (Brasil).png 483 × 291; 9 KB
-
 Coeficiente de gini (Brazil).png 483 × 291; 14 KB
-
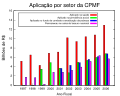 CPMF por setor.svg 600 × 480; 44 KB
-
 Desigualdade de classe social(Brasil).png 482 × 290; 8 KB
-
 Especialistas em Regulação 2006.JPG 2,280 × 1,518; 63 KB
-
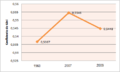
 EvolucaoPIBBrasil.png 728 × 316; 11 KB
-
 Ginicoefficient.jpg 883 × 428; 66 KB
-
 Grafico2-BRICs.png 606 × 538; 34 KB
-
 Grafico3-BRICs.png 609 × 472; 50 KB
-
 Historico petroleo.jpg 450 × 400; 40 KB
-
 Qtd Cadastrados Tesouro Direto.png 842 × 528; 25 KB
-
 Rent LatinAmerica 01.png 832 × 716; 127 KB
-
 Salary workers distribution.png 785 × 459; 47 KB
-
 South America countries by GDP.png 806 × 692; 103 KB
-
 Taxa Selic 1990 2010.png 1,023 × 780; 42 KB
-
 Taxa Selic.gif 550 × 293; 14 KB


.png)


.png)
.png)

.png)


