Category:Geothermal energy diagrams
Subcategories
This category has only the following subcategory.
P
- Geothermal power plant diagrams (28 F)
Media in category "Geothermal energy diagrams"
The following 28 files are in this category, out of 28 total.
-
 2015 Geothermal Electric Energy Generation Profile.png 507 × 338; 11 KB
-
 300px-Geothermgradients.png 300 × 411; 37 KB
-
 B1&2B3.jpg 1,304 × 1,684; 276 KB
-
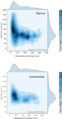
 Boxplot Europe heat flow vs Moho depth.png 2,705 × 1,943; 141 KB
-
 Centrale geotermale Ferrara.pdf 1,754 × 1,239; 690 KB
-
 Centrale geotermica di Ferrara.svg 1,608 × 1,801; 461 KB
-
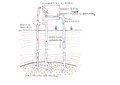
 Circuito idrotermale.png 1,280 × 720; 234 KB
-
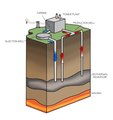
 Diagram-BinaryGeothermal.jpg 448 × 602; 162 KB
-
 DX system in a house.jpg 2,831 × 2,221; 1.48 MB
-
 Energietuebbing-cad.tif 1,024 × 475; 1.39 MB
-
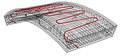 Energietuebbing-cad2.jpg 640 × 297; 83 KB
-
 Fingesrmsnncouleur.png 477 × 539; 39 KB
-
 Forages SR1 SLZ1.jpg 1,162 × 859; 79 KB
-
 Geothermal Energy Sources.svg 720 × 1,040; 180 KB
-
 Geothermal Power Station.tif 2,000 × 2,130; 12.21 MB
-
 Geothermal-energy.png 622 × 436; 125 KB
-
 GeothermalDoublet.svg 1,052 × 744; 43 KB
-
 Grafik erdsonden lüftung.001.jpg 1,024 × 768; 613 KB
-
 Impjanti Gjeotermik.jpg 727 × 885; 141 KB
-
 Lagoni 1868.jpg 1,000 × 636; 345 KB
-
 Larderello geothermal field.png 720 × 1,040; 71 KB
-
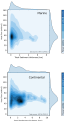
 Lithosphere thickness vs Heat Flow Marine&Continental.png 2,721 × 5,216; 696 KB
-
 Meyers b5 s0747 b1.png 383 × 127; 8 KB
-
 Sediment thickness vs Heat Flow Marine&Continental.png 2,718 × 5,111; 654 KB
-
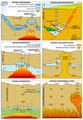 Sistemi geotermici.png 720 × 1,040; 178 KB
-
 Tableau-lindal.jpg 885 × 516; 111 KB
-
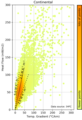 TemperatureGradient vs HeatFlow Continental.png 1,443 × 2,112; 671 KB
-
 TemperatureGradient vs HeatFlow Marine.png 1,440 × 2,128; 770 KB


