Category:Map comparisons
English: This category is about comparing maps with each other by showing how size or shapes/form of maps differ between them, or are similar. It is not about so-called thematic maps that show (and thus compare) statistical data within the same map.
Media in category "Map comparisons"
The following 22 files are in this category, out of 22 total.
-

-
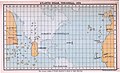 Atlantic Ocean, Toscanelli, 1474.jpg 1,990 × 1,215; 3.01 MB
-
 Avogadroren zenbakia kuboa bezala bistaratua.svg 1,280 × 720; 348 KB
-

-
 CipangoComparisonOfPiriReis1513MapToBehaimGlobe.png 1,029 × 462; 162 KB
-
 CipangoComparisonOfPiriReis1513MapToBehaimGlobe.svg 1,482 × 685; 325 KB
-
 Comparison between U.S. states and countries by GDP in 2012.jpg 1,513 × 983; 240 KB
-
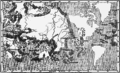 D264+265 N° 360+361. Hémisphère occidental de Martin Behaim - liv3-ch10.png 2,437 × 1,492; 1.54 MB
-
 D264- N° 360. Hémisphère occidental de Martin Behaim - liv3-ch10.png 1,276 × 1,506; 386 KB
-
 DPH-USA-comparison.png 639 × 454; 21 KB
-
 Départements français à faible population comparés à Paris et sa petite couronne.svg 1,057 × 1,100; 45 KB
-
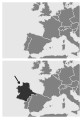 Europe with and without Listenbourg fictional country grayscale.svg 961 × 1,400; 484 KB
-
 Europe with and without Listenbourg fictional country.svg 2,087 × 1,166; 882 KB
-
 Fra Mauro World Map Satellite Comparison.jpg 1,991 × 979; 2.26 MB
-
 Kaart Bouillancourt-sous-Mianny 1800-2023.gif 500 × 574; 1.1 MB
-
 Leibnizer Fig 16 Coronelli Vergleich.jpg 1,656 × 1,495; 281 KB
-
 Map of the Waldseemüller globe in nearly rectangular projection.jpg 3,458 × 2,058; 4.2 MB
-
 OSM2023-Ortelius1584.png 1,972 × 844; 2.41 MB
-
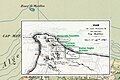 Rusguniae-1845.jpg 2,400 × 1,600; 1.22 MB
-
 Schiaparelli versus Mars.jpg 1,823 × 1,640; 2.13 MB
-

-
 World CO2 Emissions 1900-2004.jpg 1,023 × 723; 210 KB
%27_(11247041635).jpg)


.jpg)


