Category:PNG created with Matplotlib code
Media in category "PNG created with Matplotlib code"
The following 58 files are in this category, out of 58 total.
-
 12-bit RGB Cube.gif 400 × 400; 6.56 MB
-
 5th-root-of-unity.jpg 553 × 543; 62 KB
-
 AdaptiveBeamForming.png 1,291 × 653; 78 KB
-
 Bark scale approximation.png 3,000 × 2,100; 235 KB
-
 Bartl.png 1,500 × 1,000; 49 KB
-
 Bootstrapped Probability Density of the Mean of a Sample.png 640 × 480; 31 KB
-
 Cat-state-even-loss-animation.gif 220 × 128; 217 KB
-
 Cat-state-odd-loss-animation.gif 220 × 128; 286 KB
-
 Catenoid.gif 800 × 600; 1.47 MB
-
 Contour integration showing modular surface and area under contour.png 859 × 666; 267 KB
-
 Contour integration showing modular surface and path.png 760 × 663; 327 KB
-
 Fading corraza vatalaro.png 1,239 × 612; 82 KB
-
 FFT py.png 1,500 × 1,750; 113 KB
-
 Gaussian 2d surface.png 1,923 × 1,015; 215 KB
-
 Gaussian process 2D abs exp.png 648 × 325; 146 KB
-
 Gaussian process 2D squared exp.png 648 × 325; 69 KB
-
 Gaussianprocess gapUncertainty.gif 400 × 200; 156 KB
-
 GaussianProcessDecomposition Uncertainty.gif 420 × 300; 381 KB
-
 Global warming hiatus.gif 509 × 370; 500 KB
-
 GMSK PSD.png 2,100 × 1,200; 219 KB
-
 Graph of argument of square root of complex variable -pi to pi.png 894 × 740; 267 KB
-
 Inclinedthrow.gif 400 × 288; 374 KB
-
 Inclinedthrow2.gif 400 × 288; 378 KB
-
 Integration path in complex plane crossing saddle-point.png 834 × 660; 315 KB
-
 LA beam.png 1,500 × 750; 55 KB
-
Logistic map approaching the period-3 scaling limit.webm 12 s, 3,000 × 1,000; 835 KB
-
Logistic map approaching the scaling limit.webm 12 s, 3,000 × 600; 619 KB
-
 Logistic Map Bifurcation Diagram, Matplotlib, zoomed.png 3,840 × 2,880; 7.34 MB
-
 Logistic map with lyapunov exponent function.png 790 × 889; 80 KB
-
 Mandelbrot numpy set 1.png 2,560 × 1,920; 1.04 MB
-
 Mandelbrot numpy set 2.png 2,560 × 960; 927 KB
-
 Mandelbrot numpy set 3.png 2,560 × 1,920; 3.03 MB
-
 Mandelbrot numpy set 4.png 2,560 × 320; 201 KB
-
 Mandelbrot numpy set 5.png 2,560 × 1,920; 1.33 MB
-
 Mandelbrot numpy set 6.png 2,560 × 960; 1.03 MB
-
 Mandelbrot numpy set 7.png 2,560 × 960; 700 KB
-
 MDKQ anim.gif 504 × 384; 53 KB
-
 MIMO Capacity.png 3,000 × 1,500; 160 KB
-
 MUSIC MVDR.png 1,342 × 647; 112 KB
-
 Nelder-Mead Himmelblau.gif 1,000 × 1,000; 909 KB
-
 Nelder-Mead Rosenbrock.gif 1,000 × 1,000; 808 KB
-
 Nelder-Mead Simionescu.gif 1,000 × 1,000; 1.31 MB
-
 Periodogram windows.png 1,500 × 1,000; 154 KB
-
 Periodogram.png 1,500 × 1,000; 50 KB
-
 Pi 30K.gif 500 × 500; 476 KB
-
 Pictorial representation of the Cauchy inequality.png 773 × 642; 302 KB
-
 PSD MSK PSK.png 2,100 × 1,200; 246 KB
-
 Rayleigh fading.png 864 × 504; 82 KB
-
 Rosenbrock3.gif 600 × 400; 1.14 MB
-
 Slow fading Log-distance.png 864 × 792; 100 KB
-
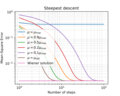 Steepest descent.png 1,500 × 1,200; 200 KB
-
 Tautochrone balls full oscillation.gif 640 × 224; 278 KB
-
 Tautochrone curve.gif 300 × 200; 102 KB
-
 Testsimulation der Vermögenskonzentration nach Fargione mit Vermögensteuern.png 1,800 × 600; 110 KB
-
 URA beam.png 2,250 × 750; 77 KB
-
 Varianz.gif 300 × 300; 135 KB
-
 Vermeintlicher Stillstand der globalen Erwärmung.gif 509 × 370; 541 KB
-
 Vermoegenskonzentration im Zeitverlauf.png 1,500 × 750; 105 KB


