Category:Photovoltaic power statistics of Germany
Media in category "Photovoltaic power statistics of Germany"
The following 32 files are in this category, out of 32 total.
-
 German Photovoltaics Installed Capacity.svg 800 × 600; 11 KB
-
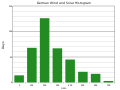
 German Wind and Solar Generation Histogram-Equal Annual.svg 800 × 600; 7 KB
-
 German Wind and Solar Generation Histogram-Equal Max Daily.svg 800 × 600; 7 KB
-
 German Wind and Solar Generation Histogram.svg 800 × 600; 7 KB
-
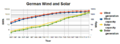 German Wind and Solar semilog.png 990 × 360; 33 KB
-
 German wind and solar-semilog.svg 800 × 600; 30 KB
-
 Germany Renewable Energy 2016-05-07 to 09.svg 750 × 560; 20 KB
-
 Germany Wind And Solar 2016-05-07 to 09.svg 750 × 560; 17 KB
-
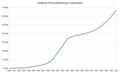
 Germany Wind and Solar Generation Percentage-semilog.svg 800 × 600; 25 KB
-
 Germany-PV-SystemPrice.png 552 × 498; 19 KB
-
 GET en 2A11 price of solar down in Germany since 2006.png 1,001 × 769; 58 KB
-
 Histogramm der PV-Anlagen Deutschland Jan2009-Mai2010.jpg 560 × 420; 18 KB
-
 Installierte Photovoltaik-Nennleistung Deutschland und weltweit.png 1,504 × 651; 39 KB
-
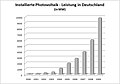
 Installierte Photovoltaikleistung in Deutschland.png 1,786 × 1,090; 85 KB
-
 Last Solareinspeisung Deutschland.png 600 × 300; 6 KB
-
 Photovoltaik Deutschland (2010).jpg 666 × 466; 56 KB
-
 Photovoltaik Deutschland.png 599 × 308; 9 KB
-
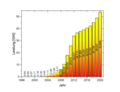 Photovoltaikleistung Deutschland 1997 bis 2020.png 1,072 × 820; 29 KB
-
 PV-Ertrag Nordbayern (Karlstadt) 2018 Monatsdarstellung.jpg 2,999 × 3,624; 3.33 MB
-
 PV-Ertrag Nordbayern (Karlstadt) 2019 Monatsdarstellung.jpg 946 × 462; 87 KB
-
 PV-Ertrag Nordbayern (Karlstadt) 2020 Monatsdarstellung.jpg 922 × 538; 90 KB
-
 PV-Ertrag Nordbayern (Karlstadt) 2021 Monatsdarstellung.png 877 × 458; 52 KB
-
 PV-Ertrag Nordbayern (Karlstadt) 2022 Monatsdarstellung.png 903 × 542; 59 KB
-
 PV-Ertrag Nordbayern (Karlstadt) 2023 Monatsdarstellung.png 1,472 × 881; 174 KB
-
 PV-Norddeutschland-2008-Monatsdarstellung.svg 956 × 726; 96 KB
-
 PV-Norddeutschland-2008-Tagesdarstellung.svg 956 × 726; 211 KB
-
 Solar und Windeinspeisung DE mit Restlast (rot).png 600 × 300; 8 KB
-
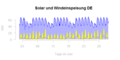 Solar und Windeinspeisung DE.png 600 × 300; 6 KB
-
 Stromproduktion Deutschland 2020 W 08 Ertrag in Zahlen.jpg 434 × 316; 75 KB
-
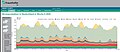
 Stromproduktion Deutschland 2020 W 08 Ertrag.jpg 1,936 × 893; 198 KB
-
 Stromproduktion Deutschland 2020 W 08 Zahlen.jpg 651 × 409; 125 KB
-
 Stromproduktion Deutschland 2020 W 08.jpg 1,869 × 806; 214 KB


.jpg)


_2018_Monatsdarstellung.jpg)
_2019_Monatsdarstellung.jpg)
_2020_Monatsdarstellung.jpg)
_2021_Monatsdarstellung.png)
_2022_Monatsdarstellung.png)
_2023_Monatsdarstellung.png)


.png)


