Category:Population density maps of the United Kingdom
Countries of Europe: Albania · Austria · Belarus · Belgium · Bulgaria · Croatia · Cyprus‡ · Czech Republic · Denmark · Estonia · Finland · France‡ · Germany · Greece · Hungary · Iceland · Republic of Ireland · Italy · Kazakhstan‡ · Latvia · Lithuania · Luxembourg · Moldova · Netherlands‡ · North Macedonia · Norway · Poland · Portugal‡ · Romania · Russia‡ · Serbia · Slovakia · Slovenia · Spain‡ · Sweden · Switzerland · Turkey‡ · Ukraine · United Kingdom
‡: partly located in Europe
‡: partly located in Europe
Subcategories
This category has only the following subcategory.
L
Media in category "Population density maps of the United Kingdom"
The following 59 files are in this category, out of 59 total.
-
 The Harmsworth atlas and Gazetter 1908 British Isles population density map.jpg 1,776 × 2,129; 5.15 MB
-
 30 of '(Longmans' Junior School Geography, etc.)' (11213569933).jpg 2,704 × 2,001; 1.18 MB
-
 33 of '(Longmans' Junior School Geography, etc.)' (11212798893).jpg 2,001 × 2,706; 1,023 KB
-

-
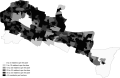
 Bi-density.png 663 × 1,069; 132 KB
-
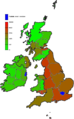
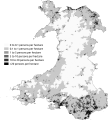
 British Isles population density 2011 countries.svg 871 × 1,346; 1.89 MB
-
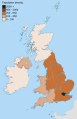 British Isles population density 2011 NUTS1.svg 871 × 1,346; 2.04 MB
-
 British Isles population density 2011 NUTS2.svg 871 × 1,346; 2.04 MB
-
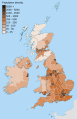 British Isles population density 2011 NUTS3.svg 871 × 1,346; 2.74 MB
-
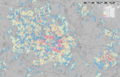
 Cities in UK and France.png 1,344 × 743; 60 KB
-
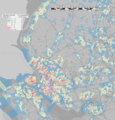
 Edinburgh population density map, 2011 census.png 2,847 × 1,777; 5.9 MB
-
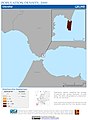
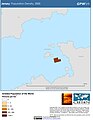
 Gibraltar Population Density, 2000 (5457620260).jpg 2,502 × 3,243; 555 KB
-
 Gibraltar Population Density, 2000 (6171908779).jpg 2,324 × 3,161; 540 KB
-
 Greater Glasgow population density map, 2011 census.png 3,364 × 1,894; 7.79 MB
-
 Greater London population density map, 2011 census.png 3,896 × 3,178; 15.52 MB
-
 Greater Manchester & Warrington population density map, 2011 census.png 4,727 × 3,324; 14.96 MB
-
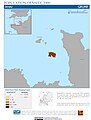
 Guernsey Population Density, 2000 (5457620162).jpg 2,502 × 3,265; 591 KB
-
 Guernsey Population Density, 2000 (6171908649).jpg 2,375 × 3,161; 561 KB
-

-
 Isle of Man Population Density, 2000 (6171910641).jpg 2,355 × 3,161; 577 KB
-
 Jersey Population Density, 2000 (5457621766).jpg 2,502 × 3,233; 583 KB
-
 Jersey Population Density, 2000 (6172440580).jpg 2,392 × 3,161; 579 KB
-
 Liverpool City Region population density map, 2011 census.png 3,638 × 3,792; 10.58 MB
-
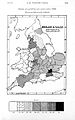
 Map of England & Wales showing population in 1750. Wellcome M0000914.jpg 1,006 × 1,679; 482 KB
-
 Map of England & Wales showing population in 1801. Wellcome M0000913.jpg 1,011 × 1,662; 545 KB
-
 Map of England & Wales showing population, 1700s. Wellcome M0000912.jpg 1,025 × 1,646; 422 KB
-
 Map of population density in England as at the 2011 census.png 15,320 × 17,435; 34.33 MB
-
 Milton Keynes population density map, 2011 census.png 3,046 × 2,455; 6.14 MB
-
 Population Density Belfast City Council 2011 Census.png 17,342 × 16,918; 7.35 MB
-
 Population Density Belfast Metropolitan Area 2011 Census.png 16,510 × 16,861; 8.92 MB
-
 Population Density Birmingham 2011 Census.png 14,237 × 17,437; 11.01 MB
-
 Population Density Bradford Metropolitan District Council Area 2011 Census.png 18,266 × 17,494; 9.54 MB
-
 Population Density Bristol 2011 Census.png 15,327 × 17,487; 8.48 MB
-
 Population Density Coventry 2011 Census.png 20,104 × 17,432; 9.53 MB
-
 Population Density Glasgow 2011 Census.png 21,064 × 17,493; 14.3 MB
-
 Population Density Greater Manchester 2011 Census.png 23,949 × 17,551; 23.47 MB
-
 Population density in northern ireland.png 18,933 × 14,742; 15.47 MB
-
 Population Density Leeds 2011 Census.png 21,558 × 17,664; 13.42 MB
-
 Population Density Leicester 2011 Census.png 16,409 × 17,610; 7.54 MB
-
 Population Density London 2011 Census.png 22,651 × 17,494; 21.17 MB
-
 Population Density Luton 2011 census.png 23,373 × 17,611; 7.54 MB
-
 Population density map in Scotland from the 2011 census.png 11,578 × 17,178; 13.84 MB
-
 Population density map in Wales from the 2011 census.png 15,625 × 17,321; 15.32 MB
-
 Population Density Nottingham 2011 census.png 13,126 × 17,434; 6.7 MB
-
 Population density of United Kingdom subdivisions.png 4,417 × 7,406; 1.7 MB
-
 Population Density Sheffield 2011 census.png 25,406 × 17,611; 11.61 MB
-
 Population Density Slough 2011 census.png 26,154 × 17,037; 6.33 MB
-
 Population density UK 2011 census.png 9,413 × 16,686; 24.46 MB
-
 Population Density West Midlands 2011 Census.png 26,154 × 17,228; 22.89 MB
-
 Population Density West Yorkshire 2011 Census.png 22,880 × 17,553; 21.63 MB
-
 Shires of Scotland by population density (2011).png 940 × 1,342; 407 KB
-
 South Hampshire population density map, 2011 census.png 3,744 × 2,251; 6.14 MB
-
 South Yorkshire population density map, 2011 census.png 4,376 × 3,393; 10.88 MB
-
 Tyne and Wear population density map, 2011 census.png 3,118 × 3,023; 7.32 MB
-
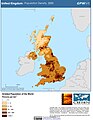 United Kingdom Population Density, 2000 (5457620078).jpg 2,502 × 3,231; 692 KB
-
 United Kingdom Population Density, 2000 (6172438022).jpg 2,324 × 3,161; 695 KB
-
 West Midlands population density map, 2011 census.png 4,933 × 3,173; 14.18 MB
-
 West Yorkshire population density map, 2011 census.png 4,529 × 3,659; 13.17 MB
-
 Плотность населения Великобритании.png 930 × 1,052; 194 KB

%27_(11213569933).jpg)
%27_(11212798893).jpg)
.jpg)


.jpg)
.jpg)


.jpg)
.jpg)
%27_(16403163210).jpg)
.jpg)
.jpg)
.jpg)


.png)


.jpg)
.jpg)


