Category:Pycnonotidae distribution maps
Media in category "Pycnonotidae distribution maps"
The following 149 files are in this category, out of 149 total.
-
 Acritillas indica distribution map.png 1,163 × 907; 133 KB
-
 Alophoixus bres distribution map.png 1,163 × 907; 137 KB
-
 Alophoixus distribution map.png 1,163 × 907; 138 KB
-
 Alophoixus finschii distribution map.png 1,163 × 907; 137 KB
-
 Alophoixus flaveolus distribution map.png 1,163 × 907; 134 KB
-
 Alophoixus ochraceus distribution map.png 1,163 × 907; 136 KB
-
 Alophoixus pallidus distribution map.png 1,163 × 907; 133 KB
-
 Alophoixus phaeocephalus distribution map.png 1,163 × 907; 135 KB
-
 Andropadus importunus distribution map.png 1,000 × 1,000; 106 KB
-
 Arizelocichla distribution map.png 1,000 × 1,000; 103 KB
-
 Arizelocichla masukuensis distribution map.png 1,000 × 1,000; 99 KB
-
 Arizelocichla milanjensis distribution map.png 1,000 × 1,000; 99 KB
-
 Arizelocichla montanus map.png 1,000 × 1,000; 96 KB
-
 Arizelocichla nigriceps distribution map.png 1,000 × 1,000; 99 KB
-
 Arizelocichla tephrolaemus distribution map.png 1,000 × 1,000; 96 KB
-
 Atimastillas flavicollis distribution map.png 1,000 × 1,000; 98 KB
-
 Baeopogon clamans distribution map.png 1,000 × 1,000; 98 KB
-
 Baeopogon distribution map.png 1,000 × 1,000; 98 KB
-
 Baeopogon indicator distribution map.png 1,000 × 1,000; 100 KB
-
 Bleda canicapillus distribution map.png 1,000 × 1,000; 97 KB
-
 Bleda distribution map.png 1,000 × 1,000; 97 KB
-
 Bleda eximius distribution map.png 1,000 × 1,000; 96 KB
-
 Bleda notatus distribution map.png 1,000 × 1,000; 96 KB
-
 Bleda syndactylus distribution map.png 1,000 × 1,000; 100 KB
-
 Calyptocichla serina distribution map.png 1,000 × 1,000; 101 KB
-
 Cerasophila thompsoni distribution map.png 1,163 × 907; 132 KB
-
 Chlorocichla distribution map.png 1,000 × 1,000; 98 KB
-
 Chlorocichla falkensteini distribution map.png 1,000 × 1,000; 97 KB
-
 Chlorocichla flaviventris distribution map.png 1,000 × 1,000; 96 KB
-
 Chlorocichla laetissima distribution map.png 1,000 × 1,000; 99 KB
-
 Chlorocichla prigoginei distribution map.png 1,000 × 1,000; 95 KB
-
 Chlorocichla simplex distribution map.png 1,000 × 1,000; 98 KB
-
 Criniger barbatus distribution map.png 1,000 × 1,000; 97 KB
-
 Criniger calurus distribution map.png 1,000 × 1,000; 100 KB
-
 Criniger chloronotus distribution map.png 1,000 × 1,000; 99 KB
-
 Criniger distribution map.png 1,000 × 1,000; 96 KB
-
 Criniger ndussumensis distribution map.png 1,000 × 1,000; 99 KB
-
 Criniger olivaceus distribution map.png 1,000 × 1,000; 96 KB
-
 Eurillas ansorgei distribution map.png 1,000 × 1,000; 101 KB
-
 Eurillas curvirostris distribution map.png 1,000 × 1,000; 99 KB
-
 Eurillas distribution map.png 1,000 × 1,000; 96 KB
-
 Eurillas gracilis distribution map.png 1,000 × 1,000; 100 KB
-
 Eurillas latirostris distribution map.png 1,000 × 1,000; 101 KB
-
 Eurillas virens distribution map.png 1,000 × 1,000; 100 KB
-
 Hemixos castanonotus distribution map.png 1,163 × 907; 133 KB
-
 Hemixos cinereus distribution map.png 1,163 × 907; 134 KB
-
 Hemixos distribution map.png 1,163 × 907; 141 KB
-
 Hemixos flavala distribution map.png 1,163 × 907; 136 KB
-
 Hypsipetes amaurotis distribution map.png 1,163 × 907; 154 KB
-
 Hypsipetes borbonicus distribution map.png 1,000 × 1,000; 95 KB
-
 Hypsipetes crassirostris distribution map 2.png 1,000 × 1,000; 95 KB
-
 Hypsipetes crassirostris distribution map Seychelles.png 700 × 369; 204 KB
-
 Hypsipetes distribution map.png 940 × 415; 68 KB
-
 Hypsipetes everetti distribution map.png 1,163 × 907; 132 KB
-
 Hypsipetes ganeesa distribution map.png 1,163 × 907; 133 KB
-
 Hypsipetes leucocephalus distribution map.png 1,163 × 907; 140 KB
-
 Hypsipetes madagascariensis distribution map.png 1,000 × 1,000; 97 KB
-
 Hypsipetes olivaceus distribution map.png 1,000 × 1,000; 95 KB
-
 Hypsipetes parvirostris distribution map.png 1,000 × 1,000; 95 KB
-
 Hypsipetes philippinus distribution map.png 1,163 × 907; 134 KB
-
 Hypsipetes rufigularis distribution map.png 1,163 × 907; 131 KB
-
 Hypsipetes siquijorensis distribution map.png 1,163 × 907; 131 KB
-
 Iole distribution map.png 1,163 × 907; 143 KB
-
 Iole olivacea distribution map.png 1,163 × 907; 139 KB
-
 Iole propinqua distribution map.png 1,163 × 907; 136 KB
-
 Iole virescens distribution map.png 1,163 × 907; 133 KB
-
 Ixonotus guttatus distribution map.png 1,000 × 1,000; 98 KB
-
 Ixos distribution map.png 1,163 × 907; 147 KB
-
 Ixos malaccensis distribution map.png 1,163 × 907; 138 KB
-
 Ixos mcclellandii distribution map.png 1,163 × 907; 140 KB
-
 Ixos nicobariensis distribution map.png 1,163 × 907; 131 KB
-
 Ixos virescens distribution map.png 1,163 × 907; 134 KB
-
 Neolestes torquatus distribution map.png 1,000 × 1,000; 100 KB
-
 Phyllastrephus albigularis distribution map.png 1,000 × 1,000; 103 KB
-
 Phyllastrephus baumanni distribution map.png 1,000 × 1,000; 98 KB
-
 Phyllastrephus cabanisi distribution map.png 1,000 × 1,000; 101 KB
-
 Phyllastrephus cerviniventris distribution map.png 1,000 × 1,000; 98 KB
-
 Phyllastrephus debilis distribution map.png 1,000 × 1,000; 98 KB
-
 Phyllastrephus distribution map.png 1,000 × 1,000; 102 KB
-
 Phyllastrephus fischeri distribution map.png 1,000 × 1,000; 98 KB
-
 Phyllastrephus flavostriatus distribution map.png 1,000 × 1,000; 101 KB
-
 Phyllastrephus fulviventris distribution map.png 1,000 × 1,000; 97 KB
-
 Phyllastrephus hypochloris distribution map.png 1,000 × 1,000; 98 KB
-
 Phyllastrephus icterinus distribution map.png 1,000 × 1,000; 101 KB
-
 Phyllastrephus leucolepis distribution map.png 1,000 × 1,000; 95 KB
-
 Phyllastrephus poensis map.png 1,000 × 1,000; 96 KB
-
 Phyllastrephus poliocephalus distribution map.png 1,000 × 1,000; 96 KB
-
 Phyllastrephus scandens distribution map.png 1,000 × 1,000; 104 KB
-
 Phyllastrephus strepitans distribution map.png 1,000 × 1,000; 100 KB
-
 Phyllastrephus terrestris distribution map.png 1,000 × 1,000; 104 KB
-
 Phyllastrephus xavieri distribution map.png 1,000 × 1,000; 99 KB
-
 Pycnonotidae distribution map.png 940 × 415; 77 KB
-
 Pycnonotus atriceps distribution map.png 1,163 × 907; 141 KB
-
 Pycnonotus aurigaster distribution map.png 1,163 × 907; 137 KB
-
 Pycnonotus barbatus distribution map.png 1,000 × 1,000; 92 KB
-
 Pycnonotus bimaculatus distribution map.png 1,163 × 907; 134 KB
-
 Pycnonotus blanfordi distribution map.png 1,163 × 907; 130 KB
-
 Pycnonotus brunneus distribution map.png 1,163 × 907; 137 KB
-
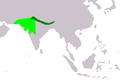
 Pycnonotus cafer distribution map.png 1,163 × 907; 136 KB
-
 Pycnonotus capensis distribution map.png 1,000 × 1,000; 97 KB
-
 Pycnonotus cinereifrons distribution map complete.png 794 × 635; 135 KB
-
 Pycnonotus cinereifrons distribution map detail.png 300 × 325; 18 KB
-
 Pycnonotus cinereifrons distribution map.png 794 × 635; 119 KB
-
 Pycnonotus conradi distribution map.png 1,163 × 907; 132 KB
-
 Pycnonotus distribution map.png 940 × 415; 77 KB
-
 Pycnonotus erythropthalmos distribution map.png 1,163 × 907; 137 KB
-
 Pycnonotus eutilotus distribution map.png 1,163 × 907; 141 KB
-
 Pycnonotus finlaysoni distribution map.png 1,163 × 907; 135 KB
-
 Pycnonotus flavescens distribution map.png 1,163 × 907; 134 KB
-
 Pycnonotus flaviventris distribution map.png 1,163 × 907; 140 KB
-
 Pycnonotus goiavier distribution map.png 1,163 × 907; 142 KB
-
 Pycnonotus hualon distribution map.png 1,163 × 907; 131 KB
-
 Pycnonotus jocosus distribution map 2.png 940 × 415; 66 KB
-
 Pycnonotus jocosus distribution map.png 940 × 415; 66 KB
-
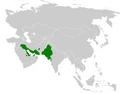
 Pycnonotus leucogenys distribution map.png 1,163 × 907; 135 KB
-
 Pycnonotus leucogrammicus distribution map.png 1,163 × 907; 133 KB
-
 Pycnonotus leucotis distribution map.png 1,163 × 907; 137 KB
-
 Pycnonotus leucotis leucogenys map editation 1.png 1,357 × 628; 18 KB
-
 Pycnonotus leucotis leucogenys map.png 348 × 233; 5 KB
-
 Pycnonotus luteolus distribution map.png 1,163 × 907; 134 KB
-
 Pycnonotus melanoleucos distribution map.png 1,163 × 907; 135 KB
-
 Pycnonotus nieuwenhuisii distribution map.png 1,163 × 907; 131 KB
-
 Pycnonotus nigricans distribution map.png 1,000 × 1,000; 98 KB
-
 Pycnonotus penicillatus distribution map big.png 794 × 635; 140 KB
-
 Pycnonotus penicillatus distribution map.png 1,163 × 907; 131 KB
-
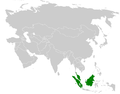
 Pycnonotus plumosus distribution map.png 1,163 × 907; 133 KB
-
 Pycnonotus simplex distribution map.png 1,163 × 907; 137 KB
-
 Pycnonotus sinensis distribution map.png 1,163 × 907; 140 KB
-
 Pycnonotus striatus distribution map.png 1,163 × 907; 133 KB
-
 Pycnonotus taivanus distribution map.png 1,163 × 907; 131 KB
-
 Pycnonotus tricolor distribution map.png 1,000 × 1,000; 97 KB
-
 Pycnonotus tympanistrigus distribution map.png 1,163 × 907; 134 KB
-
 Pycnonotus urostictus distribution map.png 1,163 × 907; 134 KB
-
 Pycnonotus xantholaemus distribution map.png 1,163 × 907; 132 KB
-
 Pycnonotus xanthopygos distribution map.png 1,163 × 907; 138 KB
-
 Pycnonotus xanthorrhous distribution map.png 1,163 × 907; 139 KB
-
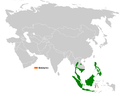
 Pycnonotus zeylanicus distribution map.png 1,163 × 907; 133 KB
-
 PycnonotusXantholaemusMap.png 299 × 297; 1 KB
-
 Setornis criniger distribution map.png 1,163 × 907; 134 KB
-
 Spizixos canifrons distribution map.png 1,163 × 907; 130 KB
-
 Spizixos distribution map.png 1,163 × 907; 133 KB
-
 Spizixos semitorques distribution map.png 1,163 × 907; 134 KB
-
 Stelgidillas gracilirostris distribution map.png 1,000 × 1,000; 100 KB
-
 Thapsinillas affinis distribution map.png 1,163 × 907; 131 KB
-
 Thapsinillas distribution map.png 1,163 × 907; 132 KB
-
 Thapsinillas longirostris distribution map.png 1,163 × 907; 132 KB
-
 Thapsinillas mysticalis distribution map.png 1,163 × 907; 131 KB
-
 Thescelocichla leucopleura distribution map.png 1,000 × 1,000; 98 KB
-
 Tricholestes criniger distribution map.png 1,163 × 907; 136 KB


