Category:RCraig09 charts showing data through 2023
English: Charts uploaded by User:RCraig09 showing data through 2023—used for tracking which charts may be due for updating.
Media in category "RCraig09 charts showing data through 2023"
The following 52 files are in this category, out of 52 total.
-

-

-

-

-

-

-

-

-

-

-

-
 1790- United States utility patents issued, by year - bar chart.svg 1,200 × 675; 11 KB
-
 1850- Warming stripes - global average surface temperature.svg 1,200 × 675; 10 KB
-
 1880- Global average sea surface temperature - global warming.svg 1,200 × 900; 8 KB
-
 1940- August global average temperature changes.svg 1,200 × 675; 5 KB
-
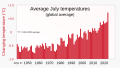 1940- July global average temperature changes.svg 1,200 × 675; 5 KB
-
 1940- June global average temperature changes.svg 1,200 × 675; 5 KB
-
 1940- October global average temperature changes.svg 1,200 × 675; 5 KB
-
 1940- September global average temperature changes.svg 1,200 × 675; 5 KB
-

-
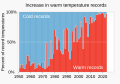 1951- Percent of record temperatures that are cold or warm records.svg 1,000 × 700; 6 KB
-

-
 1951- Warm and cold record temperatures - bar chart.svg 1,000 × 700; 6 KB
-
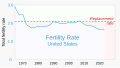 1965- Fertility rate - United States.svg 1,200 × 675; 7 KB
-
 1976- United States utility patents issued, by year - bar chart.svg 1,250 × 675; 4 KB
-
 1978- Antarctic sea ice extent - Purich and Doddridge.png 2,628 × 1,554; 603 KB
-
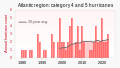 1980- Atlantic region category 4 and 5 hurricanes - NYTimes and NOAA.svg 1,200 × 675; 4 KB
-
 1983- Canada wildfires - area burned annually.svg 1,200 × 675; 3 KB
-
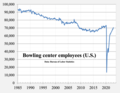 1985- Bowling center employees (U.S.).png 2,246 × 1,735; 83 KB
-
 1994- Global average temperature during June-July-August.svg 1,000 × 750; 2 KB
-
 1997- Bowling centers, league members, and lanes - normalized.svg 1,000 × 750; 3 KB
-
 1997- Bowling centers, league members, and lanes - raw numbers.svg 1,000 × 750; 3 KB
-
 1997- Lanes per bowling center.svg 1,000 × 750; 2 KB
-
 1999- Gun-related deaths USA.png 2,131 × 1,508; 67 KB
-
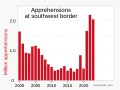 2000- Border apprehensions at southwest border.svg 1,000 × 750; 2 KB
-
 2000- Gun sales and NICS firearm background checks - U.S.svg 1,000 × 750; 6 KB
-

-
 2004- "Climate change" as a search term - Google trends.svg 1,000 × 750; 21 KB
-
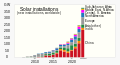 2007- New solar installations - annually by country or region.svg 1,250 × 675; 6 KB
-
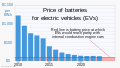 2010- Battery prices for electric vehicles.svg 1,200 × 675; 2 KB
-
 2015- Clean energy vs fossil fuel investment - IEA.svg 1,000 × 750; 3 KB
-
 2015- Passenger electric vehicle (EV) annual sales - BloombergNEF.svg 1,000 × 750; 3 KB
-

-

-
 20200327 Climate change deniers cherry picking time periods.gif 1,200 × 800; 5.41 MB
-
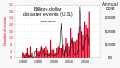 20201211 Billion dollar events related to climate change - U.S. -en.svg 1,200 × 675; 4 KB
-
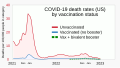 2021- COVID-19 death rates by vaccination status - US.svg 1,200 × 675; 7 KB
-

-
 202303 Global warming caused by human activities - Gallup survey.svg 1,000 × 750; 5 KB
-
 202303 I worry "a great deal" about climate change - Gallup survey.svg 1,000 × 750; 5 KB
-
 20230516 Toxic positivity - Google Trends search term history.svg 1,200 × 675; 6 KB
-
 20240311 Warming stripes BEHIND line chart - global surface temperature.svg 1,200 × 675; 18 KB


_-_Global_warming_-_NOAA.svg)

_-_Global_warming.svg)


.png)


_annual_sales_-_BloombergNEF.svg)


