Category:Run charts
graph that displays observed data in a time sequencer  | |||||
| Upload media | |||||
| Subclass of | |||||
|---|---|---|---|---|---|
| |||||
A run chart also known as a run-sequence plot is a graph that displays observed data in a time sequence. Often, the data displayed represent some aspect of the output or performance of a manufacturing or other business process.
Media in category "Run charts"
The following 10 files are in this category, out of 10 total.
-
 Company value of Samsung C&T-Cheil Industries.svg 659 × 294; 330 KB
-
 EnronStockPriceAug00Jan02.jpg 782 × 674; 123 KB
-
 Marion Forks Oregon 2007-2008 water year data plot.png 534 × 427; 9 KB
-
 ProcessCapabilityExample.svg 580 × 347; 33 KB
-
 ProcessPerformanceExample.svg 580 × 347; 33 KB
-
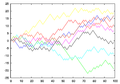 Random Walk example.png 500 × 350; 25 KB
-
 Run chart.PNG 1,161 × 754; 78 KB
-
 SimpleRunChart.jpg 574 × 326; 101 KB
-
 Évolution base de données sudoc.png 3,404 × 1,918; 195 KB
-
 Évolution base de données sudoc.svg 512 × 288; 22 KB


