Category:Tipping elements in the climate system
threshold that, when exceeded, can lead to large change in the Earth system  | |||||
| Upload media | |||||
| Instance of |
| ||||
|---|---|---|---|---|---|
| Subclass of |
| ||||
| |||||
Media in category "Tipping elements in the climate system"
The following 75 files are in this category, out of 75 total.
-
 6 dels 9 grans límits planetaris superats.webp 670 × 955; 46 KB
-
 Climate-tipping-points-en.svg 2,479 × 1,409; 420 KB
-
 Climate-tipping-points-es.svg 2,479 × 1,409; 440 KB
-
 Climate-tipping-points-interactions-de.svg 2,030 × 1,398; 373 KB
-
 Fig 1 Forcing a system past a tipping point.png 1,024 × 336; 8 KB
-
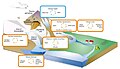
 Fig 1 Parts of the Earth system featuring tipping points.jpg 3,098 × 2,057; 2.19 MB
-
-
 Fig 1.2.13 Map of estimated organic carbon storage.png 820 × 808; 561 KB
-

-
 Fig 1.2.16 Increasing risks for cryosphere tipping elements.png 585 × 666; 99 KB
-
 Fig 1.2.2 Map of cryosphere systems considered in this chapter.png 988 × 677; 99 KB
-

-
 Fig 1.2.7 Arctic sea ice evolution 1979-2023..png 666 × 316; 133 KB
-

-
 Fig 1.2.9 Antarctic sea ice evolution 1979-2023.png 666 × 319; 115 KB
-
 Fig 1.3.1 Map of biosphere systems considered in this chapter.png 666 × 460; 268 KB
-

-
 Fig 1.3.3 Diagram with positive amplifying feedback loops.png 666 × 520; 93 KB
-
 Fig 1.3.5 A conceptual regional transect from moist.png 3,840 × 2,067; 6.71 MB
-
 Fig 1.3.8 Key feedbacks that could lead to savanna tipping..png 666 × 359; 67 KB
-
 Fig 1.4.1 Atmospheric circulation cells, dominant wind directions.png 666 × 277; 139 KB
-
 Fig 1.4.10 The role of clouds in regulating Earth’s radiation budget.png 1,024 × 541; 31 KB
-

-

-
 Fig 1.4.3 Overview over the major oceanic circulation systems in the North Atlantic.png 5,995 × 3,175; 2.05 MB
-
 Fig 1.4.4 AMOC in CMIP models.png 1,024 × 400; 56 KB
-

-
 Fig 1.5.2 Interactions between tipping systems across scales in space and time..jpg 2,662 × 1,782; 1,015 KB
-

-
 Fig 1.6.3 Map of studies that use empirical data to look for early warning signals.jpg 3,508 × 2,355; 1.93 MB
-
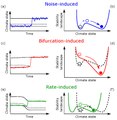
 Fig 2 Three types of tipping points.png 1,024 × 996; 57 KB
-
 Fig 2 Visual summary of the concept of positive tipping points.png 1,024 × 375; 16 KB
-

-

-
 Fig 2.4.10 Tipping cascade in Lake Chad.png 666 × 625; 132 KB
-
 Fig 2.4.5 Unique topic clusters generated using BERTopic.png 666 × 416; 106 KB
-
 Fig 2.4.6 Tipping cascades in the Amazon rainforest..png 666 × 515; 107 KB
-
 Fig 2.4.7 Tipping cascades in coral reefs and small-scale fisheries..png 666 × 602; 167 KB
-
 Fig 2.4.8 Tipping cascades in migration..png 666 × 590; 154 KB
-
 Fig 2.4.9 Tipping cascades in the Arab Spring.png 666 × 603; 133 KB
-
 Fig 3 A simple representation of hystersis.png 1,024 × 266; 8 KB
-
 Fig 3.1.1 Temporal diversity of Earth system tipping processes..png 666 × 451; 115 KB
-

-
 Fig 3.2.2 Proposed engineering techniques at tipping-point scale.png 3,316 × 1,802; 127 KB
-
 Fig 3.3.1 3 Phases of ESTP impact governance..png 666 × 666; 175 KB
-
 Fig 3.3.3 Multi-level, multi-phase ESTPl impact governance..png 3,721 × 2,093; 976 KB
-

-
 Fig 4 Early indicators before a tipping point.png 666 × 600; 85 KB
-
 Fig 4.2.1 PTP domains..png 613 × 636; 75 KB
-

-
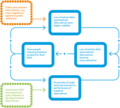 Fig 4.3.10 Positive feedbacks can drive changes in dietary norms.png 666 × 600; 96 KB
-
 Fig 4.3.11 Positive feedbacks initiated by the TIST programme.png 666 × 664; 121 KB
-

-

-
 Fig 4.3.4 ICEV Market Share in the Europe, Asia and the USA.png 666 × 396; 37 KB
-

-

-
-

-

-

-
 Fig 4.4.4 Sequence of rapid social change..png 973 × 502; 71 KB
-

-

-

-

-

-
 IPCC schematic wikipedia-cs.pdf 952 × 975; 135 KB
-
 IPCC schematic wikipedia.pdf 952 × 975; 41 KB
-
Kurzerklärt - Kipppunkte unseres Klimas - Tagesschau.webm 59 s, 720 × 1,280; 43.68 MB
-
 Liu 2023 tipping point teleconnections.png 1,536 × 1,137; 2.63 MB
-
 Mean regional trends in ice thickness and front position.webp 1,499 × 944; 124 KB
-
 Post-Glacial Sea Level.png 1,813 × 1,088; 371 KB
-
 Tipping points 2022 list.jpeg 3,646 × 2,375; 1.49 MB
-
 Wunderling 2021 tipping cascade.png 2,067 × 1,310; 251 KB


_and_associated_negative_social_tipping_processes.png)


_and_on_governance_institutions.png)


