Category:User:Dragons flight
This page shows most of the figures that Dragons flight have at various times contributed to Wikipedia. Like most materials on Wikipedia, they are licensed under the GNU Free Documentation License. If you would like to use one of these figures in a context outside of Wikipedia which is incompatible with the GFDL, then Dragons flight can be reached by Wikimail to discuss licensing terms.
Contributed Figures edit
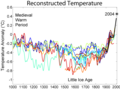
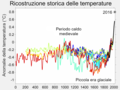
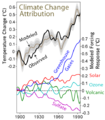
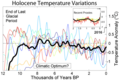
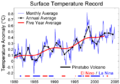
Temperature Reconstructions edit
 |
 |
 |
 |
 |
 |
 |
 |
 |
 |
Carbon Dioxide edit
 |
 |
 |
 |
 |
 |
Biodiversity and Extinctions edit
 |
 |
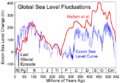
Sea Level Change edit
 |
 |
 |
 |
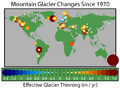
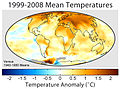
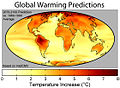
Global Maps edit
 |
 |
 |
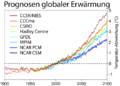
Climate Predictions edit
 |
Orbital Variations edit
 |
Milky Way Structure edit
 |
Solar Activity edit
 |
Miscellaneous Other edit
 |
 |
Contributed Photographic Images edit
 |
Media in category "User:Dragons flight"
The following 48 files are in this category, out of 48 total.
-
 1000 Jahr Temperaturen-Vergleich.png 599 × 442; 32 KB
-
 1000 Year Temperature Comparison cs.png 2,496 × 1,966; 179 KB
-
 1000 Year Temperature Comparison on SpringerImages.jpg 300 × 217; 34 KB
-
 1000 Year Temperature Comparison.png 599 × 442; 32 KB
-
 2000 Year Temperature Comparison cs.png 2,500 × 1,970; 155 KB
-
 2000 Year Temperature Comparison ro.png 600 × 450; 32 KB
-
 2000 Year Temperature Comparison-IT.png 1,449 × 1,088; 372 KB
-
 2000 Year Temperature Comparison.png 1,449 × 1,088; 341 KB
-
 65 Myr Climate Change Full.png 651 × 397; 21 KB
-
 65 Myr Climate Change.png 650 × 397; 21 KB
-
 Carbon Dioxide 400kyr.png 600 × 436; 26 KB
-
 Carbon Emission by Region.png 551 × 402; 28 KB
-
 Carbon History and Flux.png 477 × 600; 23 KB
-
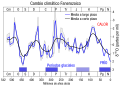
 Climate Change Attribution German.png 500 × 573; 32 KB
-
 Climate Change Attribution.png 500 × 573; 28 KB
-
 Five Myr Climate Change.png 745 × 224; 18 KB
-
 Glacier Mass Balance Map German.png 650 × 477; 35 KB
-
 Glacier Mass Balance Map.png 650 × 477; 75 KB
-
 Global Carbon Emission by Type.png 555 × 402; 17 KB
-
 Global co2 emissions graph.png 549 × 402; 11 KB
-
 Global Warming Map-he.jpg 800 × 596; 80 KB
-
 Global Warming Map.jpg 800 × 596; 212 KB
-
 Global Warming Predictions German.png 528 × 377; 21 KB
-
 Global Warming Predictions Map.jpg 559 × 408; 90 KB
-
 Global Warming Predictions-German2.png 528 × 377; 20 KB
-
 Global Warming Predictions.png 528 × 377; 25 KB
-
 Holocene Sea Level.png 512 × 364; 22 KB
-
 Holocene Temperature Variations German.png 600 × 400; 48 KB
-
 Holocene Temperature Variations.png 600 × 400; 52 KB
-
 Ice Age Temperature.png 564 × 377; 44 KB
-
 Instrumental Temperature Record int.png 525 × 390; 33 KB
-
 Instrumental Temperature Record-zh-classical.png 525 × 390; 47 KB
-
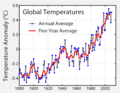 Instrumental Temperature Record.png 1,000 × 779; 44 KB
-
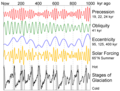 Milankovitch Variations.png 479 × 363; 32 KB
-
 Phanerozoic Carbon Dioxide.png 586 × 409; 62 KB
-
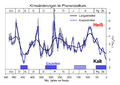 Phanerozoic Climate Change (de).png 1,075 × 759; 57 KB
-
 Phanerozoic Climate Change es.svg 726 × 520; 280 KB
-
 Phanerozoic Climate Change-es.png 726 × 520; 26 KB
-
 Phanerozoic Climate Change.png 726 × 520; 30 KB
-
 Phanerozoic Sea Level.png 523 × 360; 23 KB
-
 Post-Glacial Sea Level.png 1,813 × 1,088; 371 KB
-
 Recent Sea Level Rise German.png 537 × 373; 44 KB
-
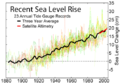 Recent Sea Level Rise.png 537 × 373; 47 KB
-
 Rekonstrukcja temperatury.png 564 × 377; 24 KB
-
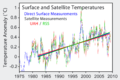 Satellite Temperatures.png 2,400 × 1,590; 297 KB
-
 Short Instrumental Temperature Record.png 510 × 359; 23 KB
-
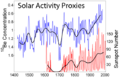 Solar Activity Proxies.png 559 × 361; 29 KB
-
 Vostok-ice-core-petit.png 598 × 441; 31 KB


.png)


