Category:Valid SVG created with Matplotlib code
Subcategories
This category has only the following subcategory.
- Valid SVG created with mplwp code (407 F)
Media in category "Valid SVG created with Matplotlib code"
The following 200 files are in this category, out of 417 total.
(previous page) (next page)-
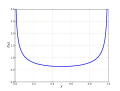
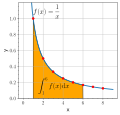 1 over x integral.svg 424 × 408; 44 KB
-
 1 over x squared integral.svg 420 × 414; 51 KB
-
 2 cfs coincide over a finite interval.svg 360 × 288; 43 KB
-
 2019 tour de france rider times.svg 1,141 × 578; 173 KB
-
 2019 tour de france top contenders.svg 1,111 × 578; 66 KB
-
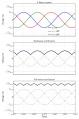 3 phase rectification 2.svg 624 × 943; 120 KB
-
 Acoustics filter bandstop.svg 576 × 432; 64 KB
-
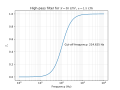 Acoustics filter highpass.svg 576 × 432; 66 KB
-
 Acoustics filter lowpass.svg 576 × 432; 57 KB
-
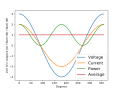 ACPower-en.svg 576 × 432; 40 KB
-
 ACRO fatalities.svg 600 × 450; 50 KB
-
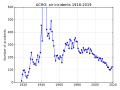 ACRO incidents.svg 600 × 450; 53 KB
-
 Administrative detainees israel en.svg 576 × 432; 59 KB
-
 Age structure aachen vs germany.svg 450 × 720; 32 KB
-
 Air density vs temperature.svg 575 × 431; 51 KB
-
 Al hydrolysis.svg 1,133 × 749; 64 KB
-
 AliasingSines.svg 675 × 225; 2 KB
-
 Alt gmsl seas not rem.svg 800 × 540; 59 KB
-
 Analytic.svg 642 × 400; 31 KB
-
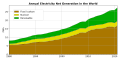 Annual world electricity net generation.svg 960 × 480; 31 KB
-
 Anscombe's quartet with Matplotlib.svg 1,536 × 799; 70 KB
-
 Arc length, Fermat.svg 615 × 618; 26 KB
-
 ArclengthSegment.svg 715 × 738; 18 KB
-
 Arcsin cdf.svg 733 × 553; 23 KB
-
 Arcsin density.svg 733 × 553; 27 KB
-
 Arcsin z vector field 01 Pengo.svg 720 × 540; 967 KB
-
 Associated Legendre Poly.svg 540 × 360; 48 KB
-
 Atan diagram.svg 575 × 449; 204 KB
-
 Atan2 diagram.svg 575 × 449; 202 KB
-
 Atmosphere-transmittance-1450-1650-Cband.svg 576 × 378; 49 KB
-
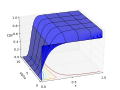 BetaDistrCDF2.svg 720 × 540; 1.82 MB
-
 Binary logarithm plot with ticks.svg 408 × 325; 56 KB
-
 Binomial confidence band uk.svg 540 × 360; 42 KB
-
 Binomial confidence band.svg 720 × 540; 43 KB
-
 Birthday paradox probability.svg 720 × 540; 51 KB
-
 Bitcoin electricity consumption.svg 810 × 630; 412 KB
-
 Bloch function.svg 765 × 333; 8 KB
-
 BlochWaves1D.svg 540 × 450; 75 KB
-
 Blue-noise-trace.svg 520 × 340; 27 KB
-
 Bluesky Registered Users.svg 960 × 576; 38 KB
-
 Bowcurve.svg 585 × 458; 25 KB
-
 Brent method example SVG.svg 720 × 540; 30 KB
-
 Cauchy cdf.svg 360 × 288; 36 KB
-
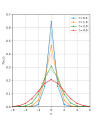
 Cauchy pdf.svg 360 × 288; 36 KB
-
 Centripetal force vs external force vectors.svg 623 × 327; 234 KB
-
 Chernoff-bound.svg 410 × 268; 41 KB
-
 Chi-square distributionCDF.svg 360 × 288; 24 KB
-
 Chi-square distributionPDF.svg 360 × 288; 23 KB
-
 Co2 by fuel pie chart.svg 540 × 540; 20 KB
-
 CO2 emission pie chart.svg 540 × 540; 76 KB
-
 CO2-Variationen schematisch.svg 616 × 384; 14 KB
-
 Complex arcsin abs 01 Pengo.svg 720 × 540; 864 KB
-
 Complex sin abs 01 Pengo.svg 720 × 540; 371 KB
-
 Complex sine.svg 720 × 540; 363 KB
-
 Constant gaussian curvature.svg 501 × 453; 568 KB
-
 Consumer Price Index Canada, All-Item Basket.svg 540 × 360; 31 KB
-
 Continuity of the Exponential at 0.svg 480 × 366; 21 KB
-
 Coordinate descent.svg 900 × 900; 56 KB
-
 Copper-resistivity-loglog.svg 520 × 340; 44 KB
-
 Copper-resistivity.svg 520 × 340; 25 KB
-
 Correlation range dependence.svg 450 × 360; 50 KB
-
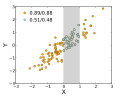
 Correlation significance.svg 360 × 305; 35 KB
-
 Cosine integral.svg 359 × 273; 66 KB
-
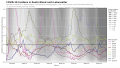 COVID-19-Inzidenz in Deutschland nach Lebensalter.svg 1,152 × 648; 166 KB
-
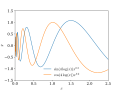
 Csch sech coth.svg 504 × 504; 18 KB
-
 Curva sobre una superficie.svg 910 × 910; 4.97 MB
-
 Cusp at (0,0.5).svg 499 × 348; 26 KB
-
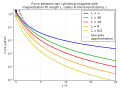
 Cylindrical-magnet-force-diagram loglog.svg 720 × 540; 81 KB
-
 Cylindrical-magnet-force-diagram logscale.svg 720 × 540; 68 KB
-
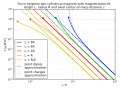 Cylindrical-magnet-force-diagram-approx loglog.svg 720 × 540; 91 KB
-
 Cylindrical-magnet-force-diagram-approx logscale.svg 720 × 540; 78 KB
-
 Cylindrical-magnet-force-diagram-approx.svg 720 × 540; 67 KB
-
 Cylindrical-magnet-force-diagram.svg 720 × 540; 57 KB
-
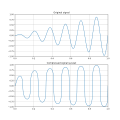
 Damped oscillation function plot.svg 1,439 × 748; 1 KB
-
 Damped Oscillation2.svg 444 × 386; 70 KB
-
 Demo of mu-law compression.svg 810 × 810; 55 KB
-

-
 Dieselprice weekly germany2014.svg 420 × 320; 58 KB
-
 Digits in largest prime found as a function of time.svg 540 × 408; 59 KB
-
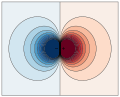 DipoleContourPoint.svg 558 × 449; 94 KB
-
 Discontinuity of function sin(1 over x).svg 575 × 431; 303 KB
-
 Discontinuity of the sign function at 0.svg 499 × 366; 27 KB
-
 Discrete Gaussian kernel.svg 450 × 538; 35 KB
-
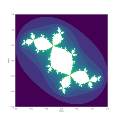 Douady rabbit, plotted with Matplotlb.svg 900 × 900; 923 KB
-
 Echantillonnage-preferentiel.svg 720 × 540; 36 KB
-
 Electricity in France.svg 680 × 450; 31 KB
-
 Electricity supplied from nuclear reactors since 1990.svg 600 × 400; 36 KB
-
 Electricity Turkey.svg 576 × 432; 45 KB
-
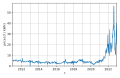 Electricity-spot-market-germany-2011-2022.svg 520 × 340; 36 KB
-
 Electricity-spot-market-germany-2011-2023.svg 520 × 340; 38 KB
-
 Emissive Power.svg 676 × 474; 62 KB
-
 Energy density.svg 1,080 × 675; 64 KB
-
 Euler-Cauchy equation solution curves complex roots.svg 575 × 431; 38 KB
-
 Euler-Cauchy equation solution curves double root.svg 575 × 431; 32 KB
-
 Euler-Cauchy equation solution curves real roots.svg 575 × 431; 31 KB
-
 Even odd harmonics.svg 575 × 450; 23 KB
-
 Example for addition of functions.svg 487 × 367; 33 KB
-
 Example of a locally constant function with sgn(x).svg 731 × 551; 24 KB
-

-
 Expinvsqlau SVG.svg 720 × 540; 43 KB
-
 Exponential cdf.svg 360 × 288; 32 KB
-
 Exponential pdf.svg 360 × 288; 32 KB
-
 Exponentials of complex number within unit circle.svg 591 × 590; 25 KB
-
 Factorial Interpolation.svg 720 × 540; 33 KB
-
 Field tidal.svg 1,123 × 608; 18 KB
-
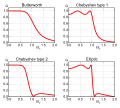
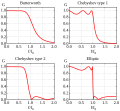
 Filters order3.svg 540 × 485; 75 KB
-
 Filters order4.svg 540 × 485; 75 KB
-
 Filters order5.svg 702 × 648; 2 KB
-
 Filters order6.svg 540 × 485; 76 KB
-
 First elements of sequence -n*(-1)^n.svg 720 × 540; 21 KB
-
 First elements of sequence -n+2*(-1)^n.svg 720 × 540; 23 KB
-
 First elements of sequence with two accumulation points.svg 720 × 540; 15 KB
-
 First members of Fibonacci sequence.svg 720 × 540; 17 KB
-
 First members of harmonic sequence.svg 720 × 540; 15 KB
-
 First members of sequence (1-n^(-2))^n.svg 720 × 540; 16 KB
-
 Fisher meta.svg 360 × 288; 169 KB
-
 Fisher transformation.svg 360 × 341; 34 KB
-
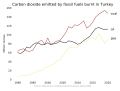 Fossil fuel CO2 Turkey line graph.svg 576 × 432; 41 KB
-
 Fractional part and its antiderivatives.svg 720 × 540; 31 KB
-
 Gamma Absolute.svg 720 × 540; 8.79 MB
-
 Gamma plus sin pi z.svg 576 × 426; 23 KB
-
 Gas contracts Turkey.svg 576 × 432; 78 KB
-
 Gas imports Turkey.svg 576 × 432; 51 KB
-
 Gaussianprocess gap.svg 360 × 180; 25 KB
-
 Gaussianprocess gapMean.svg 360 × 180; 26 KB
-
 Gaussianprocess posterior.svg 360 × 180; 43 KB
-
 Gaussianprocess posteriorMean.svg 360 × 180; 27 KB
-
 Gaussianprocess posteriorMeanNoise.svg 360 × 180; 27 KB
-
 Gaussianprocess posteriorNoise.svg 360 × 180; 44 KB
-
 Gaussianprocess prior.svg 360 × 180; 43 KB
-
 Gaussianprocess priorMean.svg 360 × 180; 23 KB
-
 Gaussianprocess SensorCalibration1Point.svg 306 × 230; 28 KB
-
 Gaussianprocess SensorCalibration2Point.svg 306 × 230; 28 KB
-
 Gaussianprocess SensorCalibrationCurves.svg 306 × 230; 58 KB
-
 Gaussianprocess SensorCalibrationCurvesMean.svg 306 × 230; 27 KB
-
 Gaussianprocess SnowboardTrend.svg 540 × 270; 45 KB
-
 Gaussianprocess TrendSnowboard.svg 540 × 270; 38 KB
-
 GaussianProcessDecomposition 3RandomSignals.svg 378 × 270; 30 KB
-
 GaussianProcessDecomposition DecomposedSignals.svg 378 × 270; 48 KB
-
 GaussianProcessDecomposition SumOf3Signals.svg 378 × 270; 20 KB
-
 Generalized normal cdfs 2.svg 720 × 540; 162 KB
-
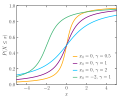
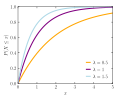
 Generalized normal cdfs.svg 720 × 540; 30 KB
-
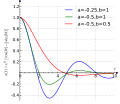
 Generalized normal densities 2.svg 720 × 540; 159 KB
-
 Generalized normal densities.svg 720 × 540; 110 KB
-
 Geometric cdf.svg 675 × 288; 116 KB
-
 Geometric pmf.svg 675 × 288; 52 KB
-
 Gershgorin Disk Theorem Example.svg 503 × 344; 24 KB
-
 Ghg bar chart Turkey.svg 576 × 432; 27 KB
-
 Ghg pie chart Turkey 2018.svg 576 × 432; 30 KB
-
 Ghg pie chart Turkey 2019.svg 576 × 432; 37 KB
-
 Ghg pie chart Turkey.svg 576 × 432; 37 KB
-
 Ghg pie chart.svg 1,080 × 1,080; 42 KB
-
 Ghg with LULUCF bar chart Turkey.svg 576 × 432; 50 KB
-
 Ghg without LULUCF bar chart Turkey.svg 900 × 540; 66 KB
-
 Global sea level rise from 1992 to 2020, satellite data chart.svg 800 × 540; 59 KB
-
 Godley-lavoie-chapter-3-sfc-model-plot.svg 619 × 499; 78 KB
-
 Gradient Visual.svg 720 × 540; 197 KB
-
 Greenhouse gas emission and absorption by Turkey.svg 576 × 432; 56 KB
-
 Greenhouse gas target Turkey.svg 576 × 432; 40 KB
-
 Haitz-law.svg 520 × 340; 59 KB
-
 Heat index plot full.svg 900 × 810; 108 KB
-
 Heat index plot.svg 900 × 810; 81 KB
-
 Himmelblau contour.svg 421 × 428; 87 KB
-
 Humidex plot (20-50°C).svg 900 × 810; 113 KB
-
 Humidex plot.svg 900 × 810; 102 KB
-
 Hyperbolic and exponential; cosh.svg 389 × 530; 72 KB
-
 Hyperbolic vs. exponential discount factors.svg 720 × 540; 14 KB
-
 Hyperbolic vs. exponential discount rates.svg 720 × 540; 13 KB
-
 HyperbolicParaboloid.svg 318 × 304; 95 KB
-
 ICC-example1.svg 720 × 540; 52 KB
-
 ICC-example2.svg 720 × 540; 52 KB
-
 Illustration of discontinuity with sgn(x) (version 2).svg 720 × 540; 20 KB
-
 Illustration of discontinuity with sgn(x) (version 3).svg 720 × 540; 20 KB
-
 Illustration of discontinuity with sgn(x) (version 4).svg 720 × 540; 20 KB
-
 Illustration of discontinuity with sgn(x).svg 720 × 540; 20 KB
-
 Industrialization per capita 1750-1900.svg 484 × 350; 50 KB
-
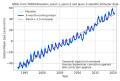
 Instrumental Temperature Record by R Rhode.svg 801 × 591; 126 KB
-
 Integration simpson.svg 350 × 109; 17 KB
-
 Interpolation-bicubic.svg 450 × 450; 74 KB
-
 Interpolation-bilinear.svg 450 × 450; 86 KB
-
 Interpolation-hermite.svg 450 × 450; 86 KB
-
 Interpolation-nearest.svg 450 × 450; 25 KB
-
 Inverse mu-law function.svg 900 × 720; 29 KB
-
 Inverted pendulum oscillatory base.svg 1,070 × 431; 60 KB
-
 IPhO participants graph.svg 600 × 400; 86 KB
-
 IPhO-2015 average scores by country.svg 720 × 480; 76 KB
-
 IPhO-2016 average scores by country.svg 720 × 480; 77 KB
-
 IPhO-2018 average scores by country.svg 720 × 480; 81 KB
-
 IPhO-2019 average scores by country.svg 720 × 480; 79 KB
-
 Ispline order3.svg 720 × 540; 43 KB
-
 Julia set, plotted with Matplotlib.svg 900 × 630; 5.11 MB
-
 Kalman Polynom Test.svg 450 × 315; 108 KB
-
 Kalman Polynom vs GLS.svg 540 × 288; 44 KB
-
 KleinBottle-cut.svg 217 × 465; 109 KB
-
 Klimaleugnung Wandel.svg 459 × 252; 50 KB
-
 Levy distributionCDF.svg 460 × 310; 54 KB
-
 Levy distributionPDF.svg 460 × 310; 68 KB
-
 Levyskew distributionCDF.svg 460 × 310; 57 KB
-
 Levyskew distributionPDF.svg 460 × 310; 71 KB
-
 Limit Infinity SVG.svg 600 × 620; 38 KB


.svg)


.svg)


.svg)


%5En.svg)
%5En.svg)


)%5En.svg)


.svg)


_(version_2).svg)
_(version_3).svg)
_(version_4).svg)
.svg)


