File:2005bauxite.png
Size of this preview: 800 × 351 pixels. Other resolutions: 320 × 140 pixels | 640 × 281 pixels | 1,425 × 625 pixels.
Original file (1,425 × 625 pixels, file size: 58 KB, MIME type: image/png)
Captions
Captions
Add a one-line explanation of what this file represents
Summary edit
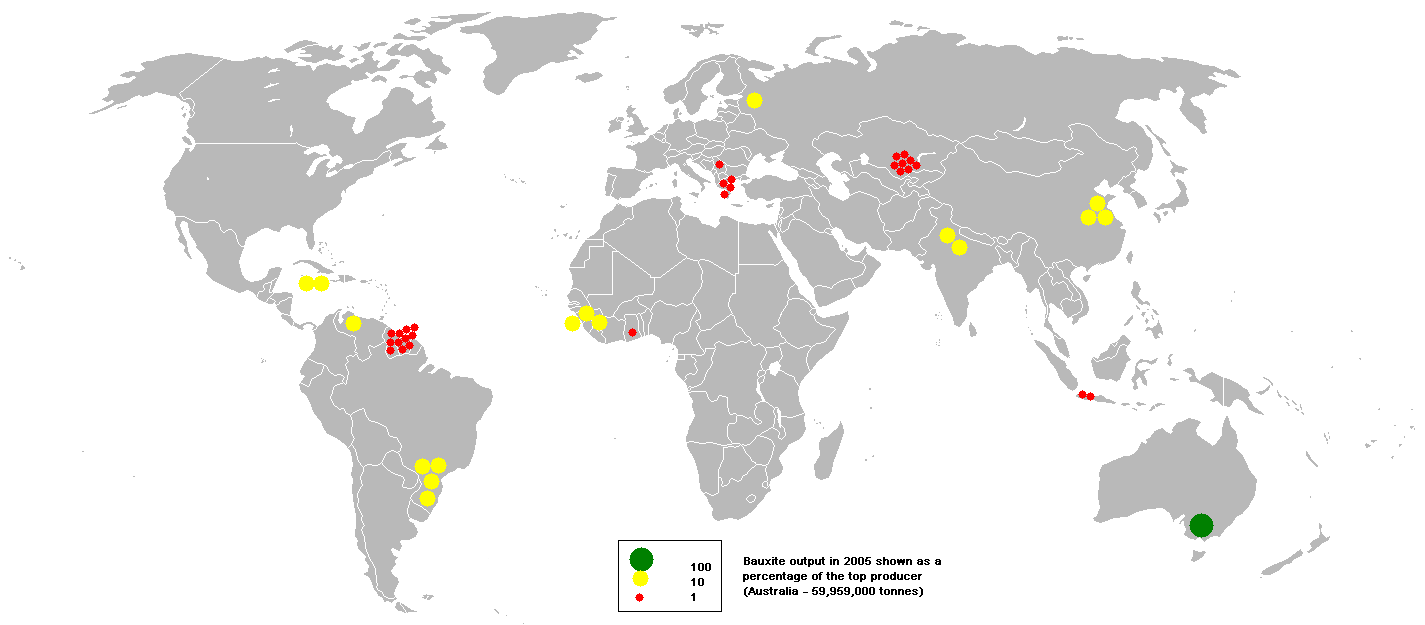
| Description | This bubble map shows the global distribution of bauxite output in 2005 as a percentage of the top producer (Australia - 59,959,000 tonnes). This map is consistent with incomplete set of data too as long as the top producer is known. It resolves the accessibility issues faced by colour-coded maps that may not be properly rendered in old computer screens. Data was extracted on 3rd June 2007. Source - British Geological Survey http://www.bgs.ac.uk/mineralsuk/commodity/world/home.html Based on Image:BlankMap-World.png |
| Date | |
| Source | http://www.bgs.ac.uk/mineralsuk/commodity/world/home.html [1] |
| Author | en:User:Anwar saadat |
![[1]](https://en.wikipedia.org/wiki/Image:2005bauxite.PNG)
Licensing edit
| This file is licensed under the Creative Commons Attribution-Share Alike 3.0 Unported license. Subject to disclaimers. | ||
| ||
| This licensing tag was added to this file as part of the GFDL licensing update. |

|
Permission is granted to copy, distribute and/or modify this document under the terms of the GNU Free Documentation License, Version 1.2 or any later version published by the Free Software Foundation; with no Invariant Sections, no Front-Cover Texts, and no Back-Cover Texts. A copy of the license is included in the section entitled GNU Free Documentation License. Subject to disclaimers. |
File history
Click on a date/time to view the file as it appeared at that time.
| Date/Time | Thumbnail | Dimensions | User | Comment | |
|---|---|---|---|---|---|
| current | 20:45, 4 March 2008 | | 1,425 × 625 (58 KB) | Toony (talk | contribs) | {{Information |Description=This bubble map shows the global distribution of bauxite output in 2005 as a percentage of the top producer (Australia - 59,959,000 tonnes). This map is consistent with incomplete set of data too as long as the top producer is k |
You cannot overwrite this file.
File usage on Commons
There are no pages that use this file.
File usage on other wikis
The following other wikis use this file:
- Usage on ar.wikipedia.org
- Usage on ast.wikipedia.org
- Usage on az.wikipedia.org
- Usage on bn.wikipedia.org
- Usage on bs.wikipedia.org
- Usage on de.wikipedia.org
- Usage on en.wikipedia.org
- Usage on es.wikipedia.org
- Usage on fa.wikipedia.org
- Usage on fr.wikipedia.org
- Usage on hu.wikipedia.org
- Usage on hy.wikipedia.org
- Usage on it.wikipedia.org
- Usage on ja.wikipedia.org
- Usage on kn.wikipedia.org
- Usage on mg.wikipedia.org
- Usage on nds.wikipedia.org
- Usage on no.wikipedia.org
- Usage on pt.wikipedia.org
- Usage on ru.wikipedia.org
- Usage on sl.wikipedia.org
- Usage on sr.wikipedia.org
- Usage on sv.wikipedia.org
- Usage on ta.wikipedia.org
- Usage on th.wikipedia.org
- Usage on tr.wikipedia.org
- Usage on uk.wikipedia.org
- Usage on ur.wikipedia.org
- Usage on vi.wikipedia.org