File:2005crustacean.PNG
Size of this preview: 800 × 351 pixels. Other resolutions: 320 × 140 pixels | 640 × 281 pixels | 1,425 × 625 pixels.
Original file (1,425 × 625 pixels, file size: 58 KB, MIME type: image/png)
Captions
Captions
Add a one-line explanation of what this file represents
| Description |
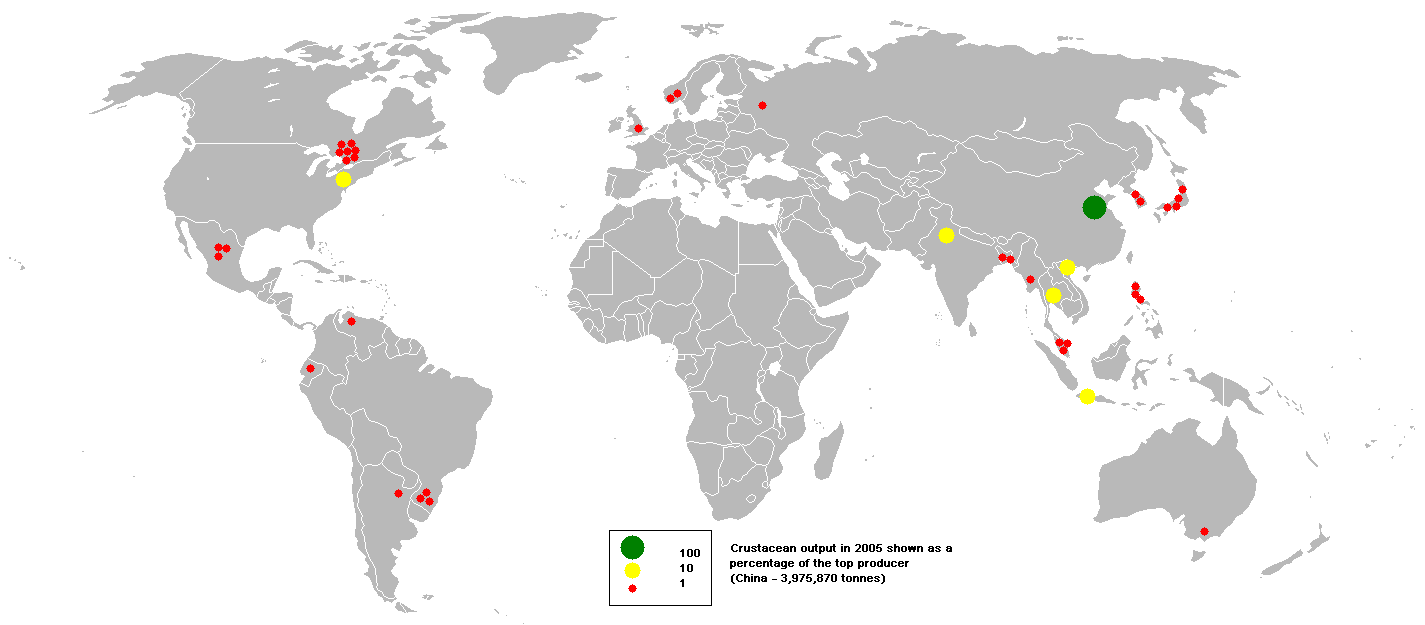
English: This bubble map shows the global distribution of crustacean output in 2005 as a percentage of the top producer (China - 3,975,870 tonnes). This map is consistent with incomplete set of data too as long as the top producer is known. It resolves the accessibility issues faced by colour-coded maps that may not be properly rendered in old computer screens. Based on en:Image:BlankMap-World.png The original description page was here. All following user names refer to en.wikipedia. |
||
| Date | |||
| Source | http://faostat.fao.org/site/336/ | ||
| Author | Anwar saadat | ||
| Permission (Reusing this file) |
|
File history
Click on a date/time to view the file as it appeared at that time.
| Date/Time | Thumbnail | Dimensions | User | Comment | |
|---|---|---|---|---|---|
| current | 07:57, 23 February 2010 | | 1,425 × 625 (58 KB) | Stemonitis (talk | contribs) | {{BotMoveToCommons|en.wikipedia|year={{subst:CURRENTYEAR}}|month={{subst:CURRENTMONTHNAME}}|day={{subst:CURRENTDAY}}}} {{Move to Commons}}This bubble map shows the global distribution of crustacean output in 200 |
You cannot overwrite this file.
File usage on Commons
There are no pages that use this file.