File:A graph to show the increase in gasoline prices.jpg

Size of this preview: 800 × 600 pixels. Other resolutions: 320 × 240 pixels | 640 × 480 pixels | 1,024 × 768 pixels.
Original file (1,024 × 768 pixels, file size: 148 KB, MIME type: image/jpeg)
Captions
Captions
Add a one-line explanation of what this file represents
Summary edit
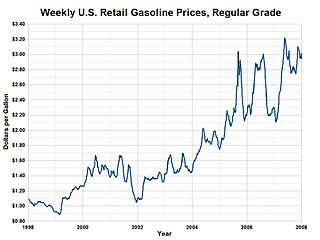
| Description | A graph to show the increase in gasoline prices. Average weekly gasoline prices generally declined, adjusted for inflation, until 1999, but in current prices (shown) were last below $1.00 that year. After this period, in the 2008 recession, prices collapsed to $1.60, and then returned to above $3.50. |
| Date | Various |
| Source | http://www.eia.doe.gov/oil_gas/petroleum/data_publications/wrgp/mogas_home_page.html |
| Author | EIA |
Licensing edit
| This image is a work of a United States Department of Energy (or predecessor organization) employee, taken or made as part of that person's official duties. As a work of the U.S. federal government, the image is in the public domain.
Please note that national laboratories operate under varying licences and some are not free. Check the site policies of any national lab before crediting it with this tag.
|

|
File history
Click on a date/time to view the file as it appeared at that time.
| Date/Time | Thumbnail | Dimensions | User | Comment | |
|---|---|---|---|---|---|
| current | 15:33, 11 July 2014 | | 1,024 × 768 (148 KB) | Delphi234 (talk | contribs) | show increase |
| 06:51, 29 February 2008 |  | 538 × 444 (79 KB) | Anonymous101 (talk | contribs) | {{Information |Description=A graph to show the increase in gasoline prices (no data changed from government version but watermark removed from image |Source=http://www.eia.doe.gov/oil_gas/petroleum/data_publications/wrgp/mogas_home_page.html |Date=Various |
You cannot overwrite this file.
File usage on Commons
There are no pages that use this file.
File usage on other wikis
The following other wikis use this file:
- Usage on en.wikinews.org