File:AsymptoticStabilityImpulseScilab.png
No higher resolution available.
AsymptoticStabilityImpulseScilab.png (530 × 270 pixels, file size: 4 KB, MIME type: image/png)
Captions
Captions
Add a one-line explanation of what this file represents

|
This file was moved to Wikimedia Commons from en.wikipedia using a bot script. All source information is still present. It requires review. Additionally, there may be errors in any or all of the information fields; information on this file should not be considered reliable and the file should not be used until it has been reviewed and any needed corrections have been made. Once the review has been completed, this template should be removed. For details about this file, see below. Check now! |
Summary edit
| Description |
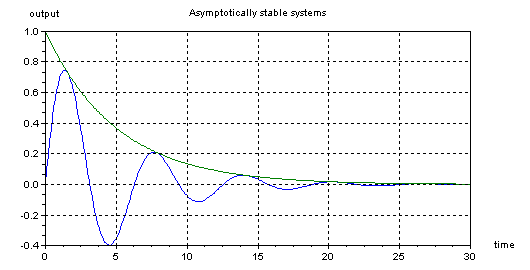
English: Plots of the impulse response for two similar asymptotically stable systems.
Green curve: Blue curve: Aside from formatting, the following MATLAB code will generate this plot: >> X = [0:0.1:30]; >> Y = exp(-X.*0.2).*sin(X); >> Z = exp(-X.*0.2); >> plot(X,Y,X,Z); Creation InfoCreated by me in Scilab (www.scilab.org), 24/10/05. Released into public domain with this upload. Do with it what you will. - Jenesis 21:57, 24 October 2005 (UTC) |
| Date | 24 October 2005 (original upload date) |
| Source | Own work |
| Author | Jenesis at English Wikipedia |


Licensing edit
| |
This work has been released into the public domain by its author, Jenesis, at the English Wikipedia project. This applies worldwide. In case this is not legally possible: |
Original upload log edit
The original description page was here. All following user names refer to en.wikipedia.
- 2005-10-24 21:56 Jenesis 530×270 (4290 bytes) Created by me in Scilab (www.scilab.org), 24/10/05. Released into public domain with this upload. Do with it what you will.
File history
Click on a date/time to view the file as it appeared at that time.
| Date/Time | Thumbnail | Dimensions | User | Comment | |
|---|---|---|---|---|---|
| current | 18:31, 21 May 2012 | | 530 × 270 (4 KB) | MGA73bot2 (talk | contribs) | {{BotMoveToCommons|en.wikipedia|year={{subst:CURRENTYEAR}}|month={{subst:CURRENTMONTHNAME}}|day={{subst:CURRENTDAY}}}} == {{int:filedesc}} == {{Information |description={{en|1=Plots of the impulse response for two similar ... |
You cannot overwrite this file.
File usage on Commons
There are no pages that use this file.
File usage on other wikis
The following other wikis use this file:
- Usage on ar.wikipedia.org
- Usage on ca.wikipedia.org
- Usage on en.wikipedia.org
- Talk:Dynamical system
- Talk:Sharkovskii's theorem
- Talk:Interplanetary Transport Network
- Talk:Orbit (dynamics)
- Talk:Hamiltonian mechanics
- Talk:Accumulation point
- Talk:Hilbert's sixteenth problem
- Talk:Attractor
- Talk:Ergodic theory
- Talk:State space (computer science)
- Talk:Poincaré map
- Talk:Lyapunov stability
- Talk:Metastability
- Exponential stability
- Talk:Equidistributed sequence
- Talk:Fundamental domain
- Talk:Phase space
- Talk:Perron–Frobenius theorem
- Talk:Entrainment (physics)
- Talk:List of dynamical systems and differential equations topics
- Talk:Kolmogorov–Arnold–Moser theorem
- Talk:Nonlinear system
- Talk:Virtual displacement
- Talk:Poincaré recurrence theorem
- Talk:Lyapunov function
- Talk:Anosov diffeomorphism
- Talk:Virtual work
- Talk:Evolutionary computation
- Talk:Mixing (mathematics)
- Talk:Dynamical billiards
- Talk:Helmholtz theorem (classical mechanics)
- Talk:Oscillation
- Talk:Catastrophe theory
- Talk:Poincaré–Bendixson theorem
- Talk:Hopf bifurcation
- Talk:Lyapunov exponent
- Talk:Measure-preserving dynamical system
- Talk:Artin–Mazur zeta function
- Talk:Structural stability
- Talk:LaSalle's invariance principle
- Talk:Bifurcation theory
- Talk:Limit cycle
- Talk:Denjoy's theorem on rotation number
- Talk:Takens's theorem
- Talk:De Bruijn graph
- Talk:Saddle-node bifurcation
- Talk:VisSim
- Talk:Heteroclinic orbit
View more global usage of this file.