File:Banner25AoverBHISTredline.png
Size of this preview: 800 × 470 pixels. Other resolutions: 320 × 188 pixels | 640 × 376 pixels | 1,164 × 684 pixels.
Original file (1,164 × 684 pixels, file size: 34 KB, MIME type: image/png)
Captions
Captions
Add a one-line explanation of what this file represents
Summary edit
| Description |
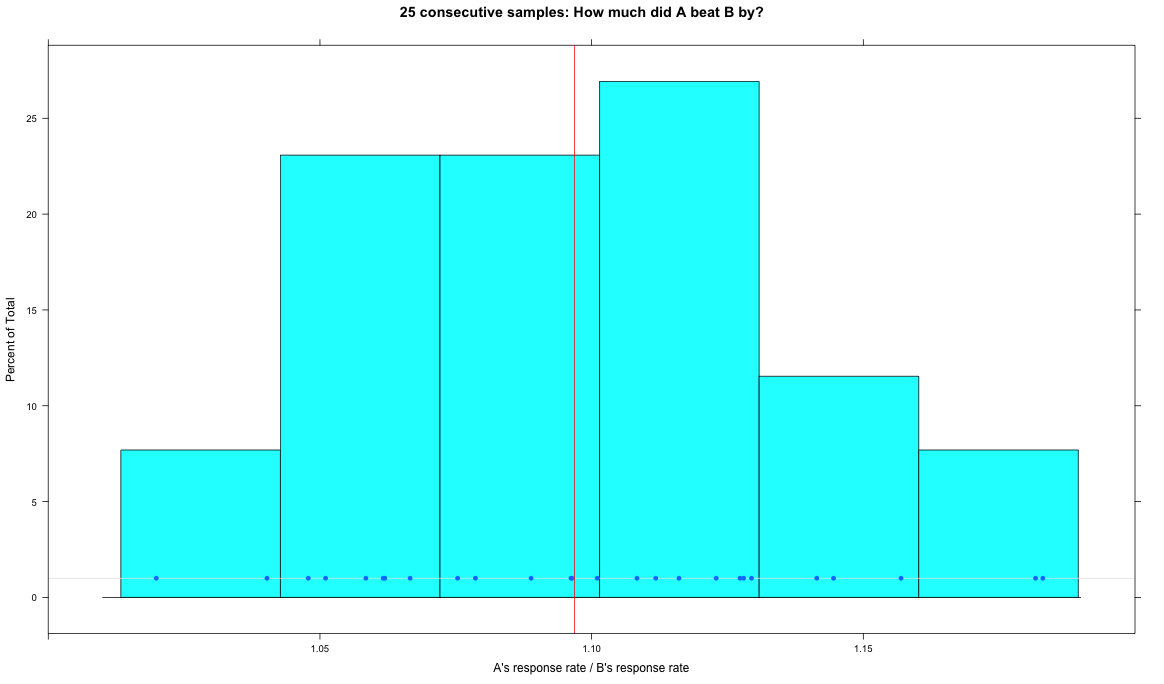
English: This graph is from a statistics exercise of the Wikimedia Foundation fundraising department. We went back to one of our largest test samples, where we ran two banners -- A vs B -- for a very long time. The response rates across a range of low-donation-rate countries were 56 and 50 per 100,000 respectively. We chopped that long test up into 25 smaller samples that are closer to the size of our typical tests — in this case with about 3.5 million banner views per banner per test. Then we checked how often those short tests accurately represented the “true”(er) result of the full test.
The graph shows by how much A beat B in each test (each subset of the larger test actually). The red vertical line represents the true(er) value of how much A beats B based on the entire large sample. Each dot represents A’s winning margin in a different test — 1.1 means A beat B by 10 percent. This kind of graph is called a histogram. The bars show how many results fit into different ranges. You can see that most of the tests fall around a central value. This is good to see! Our stats methods assume the data conforms to a certain pattern, which is called a “normal distribution.” And this is one indication that our data is normal. |
| Date | |
| Source | Own work |
| Author | Zack Exley & Sahar Massachi |
Licensing edit
This file is licensed under the Creative Commons Attribution-Share Alike 3.0 Unported license.
- You are free:
- to share – to copy, distribute and transmit the work
- to remix – to adapt the work
- Under the following conditions:
- attribution – You must give appropriate credit, provide a link to the license, and indicate if changes were made. You may do so in any reasonable manner, but not in any way that suggests the licensor endorses you or your use.
- share alike – If you remix, transform, or build upon the material, you must distribute your contributions under the same or compatible license as the original.
File history
Click on a date/time to view the file as it appeared at that time.
| Date/Time | Thumbnail | Dimensions | User | Comment | |
|---|---|---|---|---|---|
| current | 21:36, 10 April 2013 | | 1,164 × 684 (34 KB) | ZExley (WMF) (talk | contribs) | {{Information |Description ={{en|1=This graph is from a statistics exercise of the Wikimedia Foundation fundraising department. We went back to one of our largest test samples, where we ran two banners -- A vs B -- for a very long time. The response... |
You cannot overwrite this file.
File usage on Commons
There are no pages that use this file.