File:BenfordDensities.png

Size of this preview: 800 × 507 pixels. Other resolutions: 320 × 203 pixels | 640 × 406 pixels | 1,024 × 649 pixels | 1,508 × 956 pixels.
Original file (1,508 × 956 pixels, file size: 74 KB, MIME type: image/png)
Captions
Captions
Add a one-line explanation of what this file represents
Summary edit
| Description |
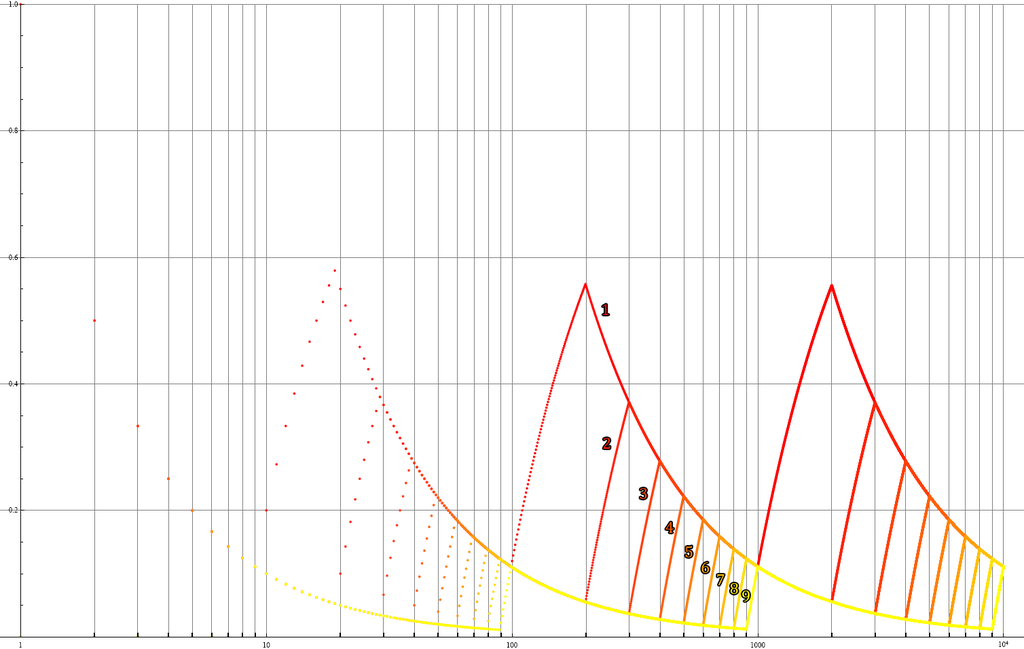
English: A graph of the densities of the sets of numbers starting with 1 up to 9, showing how the average density of numbers starting with 1 is higher than the rest. In fact, the average densities correspond exactly to the proportions predicted by Benford's law.
Selfmade in Mathematica. |
||
| Date | 25 December 2008 (original upload date) | ||
| Source | Transferred from en.wikipedia to Commons by User:Tam0031 using CommonsHelper. | ||
| Author | Sam Derbyshire at en.wikipedia | ||
| Other versions |
|

Licensing edit
Sam Derbyshire at en.wikipedia, the copyright holder of this work, hereby publishes it under the following licenses:
This file is licensed under the Creative Commons Attribution-Share Alike 3.0 Unported license.
Attribution: Sam Derbyshire at en.wikipedia
- You are free:
- to share – to copy, distribute and transmit the work
- to remix – to adapt the work
- Under the following conditions:
- attribution – You must give appropriate credit, provide a link to the license, and indicate if changes were made. You may do so in any reasonable manner, but not in any way that suggests the licensor endorses you or your use.
- share alike – If you remix, transform, or build upon the material, you must distribute your contributions under the same or compatible license as the original.

|
Permission is granted to copy, distribute and/or modify this document under the terms of the GNU Free Documentation License, Version 1.2 or any later version published by the Free Software Foundation; with no Invariant Sections, no Front-Cover Texts, and no Back-Cover Texts. A copy of the license is included in the section entitled GNU Free Documentation License. |
You may select the license of your choice.
Original upload log edit
The original description page was here. All following user names refer to en.wikipedia.
- 2008-12-25 11:00 Sam Derbyshire 1508×956× (75299 bytes) A graph of the densities of the sets of numbers starting with 1 up to 9, showing how the average density of numbers starting with 1 is higher than the rest. In fact, the average densities correspond exactly to the proportions predicted by Benford's law.

This diagram was created with Mathematica.
File history
Click on a date/time to view the file as it appeared at that time.
| Date/Time | Thumbnail | Dimensions | User | Comment | |
|---|---|---|---|---|---|
| current | 17:51, 5 June 2009 | | 1,508 × 956 (74 KB) | File Upload Bot (Magnus Manske) (talk | contribs) | {{BotMoveToCommons|en.wikipedia|year={{subst:CURRENTYEAR}}|month={{subst:CURRENTMONTHNAME}}|day={{subst:CURRENTDAY}}}} {{Information |Description={{en|A graph of the densities of the sets of numbers starting with 1 up to 9, showing how the average densit |
You cannot overwrite this file.
File usage on Commons
There are no pages that use this file.
File usage on other wikis
The following other wikis use this file:
- Usage on en.wikipedia.org
- Usage on ja.wikipedia.org