File:BerryEsseenTheoremCDFGraphExample.png
Original file (739 × 825 pixels, file size: 5 KB, MIME type: image/png)
Captions
Captions

|
This graph image could be re-created using vector graphics as an SVG file. This has several advantages; see Commons:Media for cleanup for more information. If an SVG form of this image is available, please upload it and afterwards replace this template with
{{vector version available|new image name}}.
It is recommended to name the SVG file “BerryEsseenTheoremCDFGraphExample.svg”—then the template Vector version available (or Vva) does not need the new image name parameter. |
Transferred from en.wikipedia to Commons by Maksim.
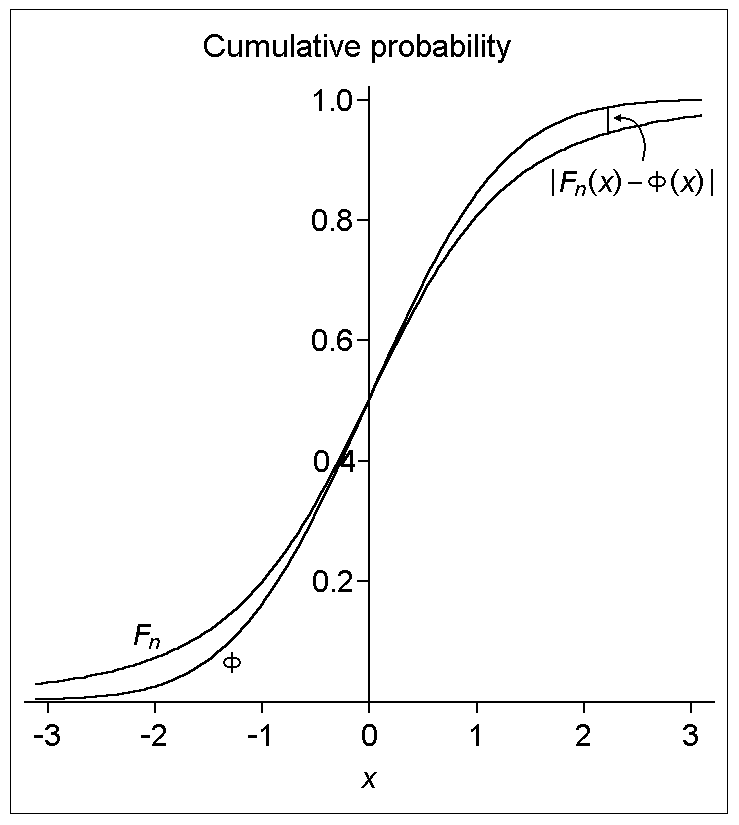
This image illustrates the difference (or distance) between the cumulative distribution functions of the standard normal distribution (Φ) and a hypothetical distribution of a standardized sample mean (Fn), as alluded to in the Berry-Esséen theorem. (Specifically, the plotted hypothetical distribution is a t distribution with 3 degrees of freedom.)
| This work has been released into the public domain by its author, Dcljr. This applies worldwide. In some countries this may not be legally possible; if so: |
en:User:Dcljr#Licensing of contributions
I originally created this image using the R programming language (version 1.4.1 for Microsoft Windows), edited it in Microsoft Paint, and then cropped it and converted it to PNG format in ACDSee (version 3.1 for Windows).
| date/time | username | edit summary |
|---|---|---|
| 20:55, 4 June 2005 | en:User:Ellmist | (remove links to talk pages) |
| 23:17, 25 March 2005 | en:User:Ellmist | ({{PD-user|Dcljr}}) |
| 21:02, 23 March 2005 | en:User:Dcljr | (+ {{PD-self}}) |
| 19:50, 21 March 2005 | en:User:Ellmist | ({{unknown}} <a href="/wiki/User_talk:Dcljr#Image:BerryEsseenTheoremCDFGraphExample.png" title="User talk:Dcljr">User talk:Dcljr#Image:BerryEsseenTheoremCDFGraphExample.png</a>) |
| 06:52, 5 September 2004 | en:User:Dcljr | (corrected df on t for new image) |
| 18:51, 2 September 2004 | en:User:Dcljr | (bypass redirect to "Berry-Esseen theorem") |
| 10:33, 28 August 2004 | en:User:Dcljr | (+ "standardized"; + italics on sub-n) |
| 10:16, 28 August 2004 | en:User:Dcljr | (described the purpose of the image and expanded on how it came to be; wkf) |
| 09:59, 28 August 2004 | en:User:Dcljr | (I created this image using R version 1.4.1 for Windows; edited it in Microsoft Paint; cropped it and converted it to PNG in ACDSee 3.1 for Windows.) |
Original upload log edit
Legend: (cur) = this is the current file, (del) = delete this old version, (rev) = revert to this old version.
Click on date to download the file or see the image uploaded on that date.
- (del) (cur) 06:48, 5 September 2004 . . en:User:Dcljr Dcljr ( en:User_talk:Dcljr Talk) . . 739x825 (4641 bytes) (I created this image in R for Windows 95, edited it in Microsoft Paint, and cropped and converted it to PNG in ACDSee 3.1 for Windows)
- (del) (rev) 09:59, 28 August 2004 . . en:User:Dcljr Dcljr ( en:User_talk:Dcljr Talk) . . 734x769 (3695 bytes) (I created this image using R version 1.4.1 for Windows; edited it in Microsoft Paint; cropped it and converted it to PNG in ACDSee 3.1 for Windows.)
File history
Click on a date/time to view the file as it appeared at that time.
| Date/Time | Thumbnail | Dimensions | User | Comment | |
|---|---|---|---|---|---|
| current | 17:17, 18 March 2006 | | 739 × 825 (5 KB) | Maksim (talk | contribs) | La bildo estas kopiita de wikipedia:en. La originala priskribo estas: This image illustrates the difference (or distance) between the cumulative distribution functions of the standard normal distribution (Φ) and a hypothetical distribution of |
You cannot overwrite this file.
File usage on Commons
There are no pages that use this file.
File usage on other wikis
The following other wikis use this file:
- Usage on be.wikipedia.org
- Usage on en.wikipedia.org
- Usage on fr.wikipedia.org