File:Binaryvdecimal.svg

Size of this PNG preview of this SVG file: 776 × 600 pixels. Other resolutions: 311 × 240 pixels | 621 × 480 pixels | 994 × 768 pixels | 1,280 × 989 pixels | 2,560 × 1,978 pixels | 990 × 765 pixels.
Original file (SVG file, nominally 990 × 765 pixels, file size: 14 KB)
Captions
Captions
Add a one-line explanation of what this file represents
Summary edit
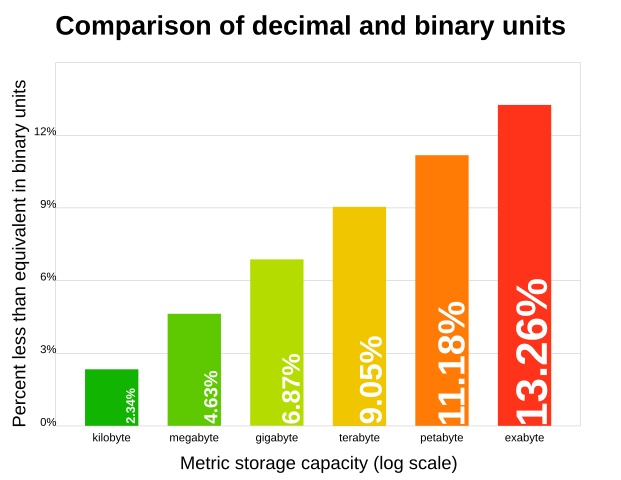
| Description |
English: This chart shows the growing percentage of the shortfall of decimal interpretations from binary interpretations of the unit prefixes plotted against the logarithm of storage size. Example uses multiple units of bytes. |
| Source | Own work |
| Author | Ryoushi19 |
| Other versions |
|


W3C-validity not checked.

|
This SVG file contains embedded text that can be translated into your language, using any capable SVG editor, text editor or the SVG Translate tool. For more information see: About translating SVG files. |
Licensing edit
| I, the copyright holder of this work, release this work into the public domain. This applies worldwide. In some countries this may not be legally possible; if so: I grant anyone the right to use this work for any purpose, without any conditions, unless such conditions are required by law. |
File history
Click on a date/time to view the file as it appeared at that time.
| Date/Time | Thumbnail | Dimensions | User | Comment | |
|---|---|---|---|---|---|
| current | 10:21, 24 November 2021 | | 990 × 765 (14 KB) | حبيشان (talk | contribs) | Reverted to version as of 13:47, 9 April 2017 (UTC) |
| 10:12, 24 November 2021 |  | 990 × 765 (15 KB) | حبيشان (talk | contribs) | بالعربية | |
| 13:47, 9 April 2017 |  | 990 × 765 (14 KB) | Eyesnore (talk | contribs) | Revised for capitalization and spelling | |
| 01:07, 24 September 2009 |  | 990 × 765 (14 KB) | Kbrose (talk | contribs) | {{Information |Description={{en|1=This chart shows the growing percentage of the difference between decimal and binary interpretations of the unit prefixes plotted against the logarithm of storage size. Example uses multiple units of bytes.}} |Source=*[[: | |
| 04:19, 3 September 2009 |  | 990 × 765 (14 KB) | JRaber (talk | contribs) | Reverted to version as of 06:18, 18 May 2009 because current version values are incorrect. | |
| 07:12, 26 July 2009 |  | 990 × 765 (16 KB) | JRaber (talk | contribs) | Updated: Fixed values and graph. Additional Minor tweaks. | |
| 06:18, 18 May 2009 |  | 990 × 765 (14 KB) | Ryoushi19 (talk | contribs) | {{Information |Description={{en|1=This chart shows how much percentage less a decimal byte is in comparison to a binary byte. It also illustrates the trend that as the prefix changes, the decimal byte begins to show an even greater difference from the bi |
You cannot overwrite this file.
File usage on Commons
The following 4 pages use this file:
File usage on other wikis
The following other wikis use this file:
- Usage on as.wikipedia.org
- Usage on en.wikipedia.org
- Usage on eu.wikipedia.org
- Usage on hy.wikipedia.org
- Usage on it.wikipedia.org
- Usage on ko.wikipedia.org
- Usage on mk.wikipedia.org
- Usage on ml.wikipedia.org
- Usage on nl.wikibooks.org
- Usage on ru.wikipedia.org
- Usage on sq.wikipedia.org