File:Bipolar coordinates.svg

Size of this PNG preview of this SVG file: 600 × 600 pixels. Other resolutions: 240 × 240 pixels | 480 × 480 pixels | 768 × 768 pixels | 1,024 × 1,024 pixels | 2,048 × 2,048 pixels | 700 × 700 pixels.
Original file (SVG file, nominally 700 × 700 pixels, file size: 14 KB)
Captions
Captions
Add a one-line explanation of what this file represents
Summary edit
| Description |
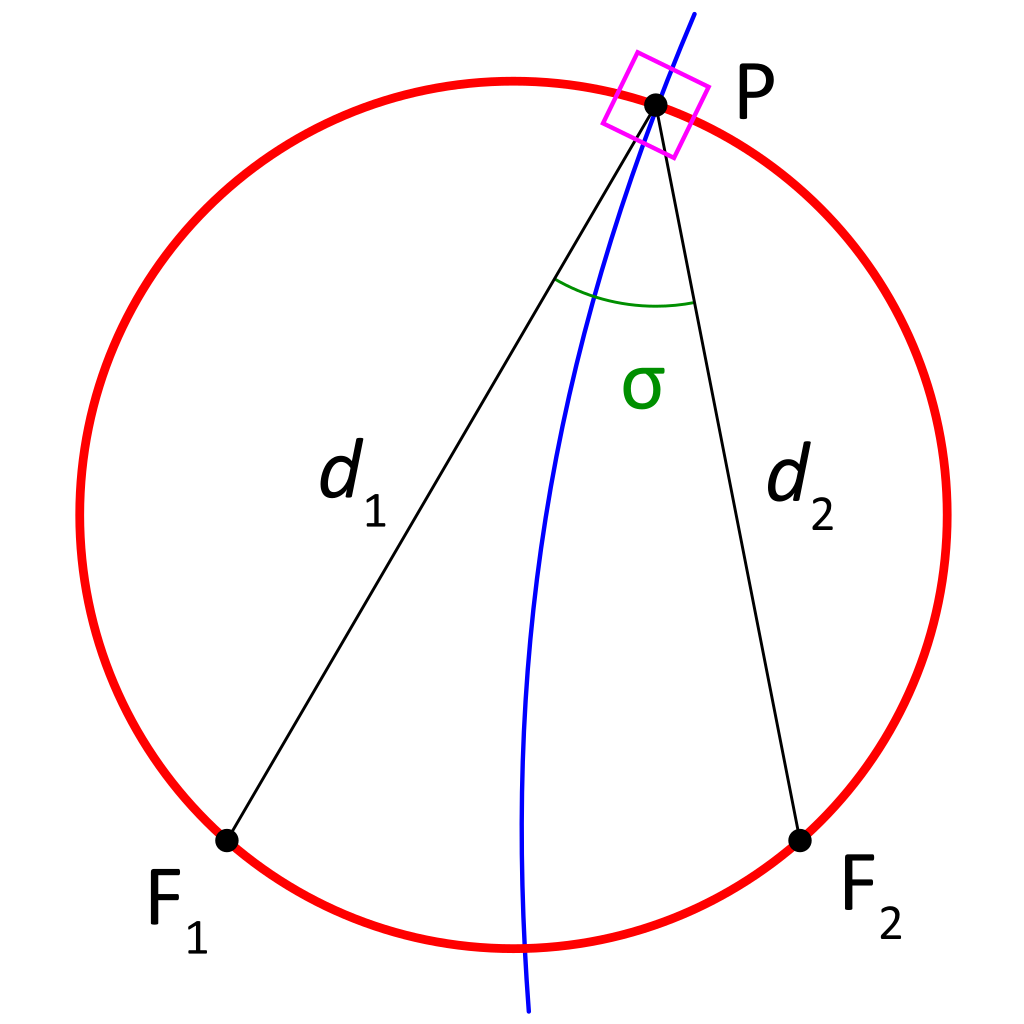
English: Illustration of the bipolar coordinate system. σ is the angle between the two foci and the point in question, whereas τ is the logarithm of the ratio of the distances. The corresponding σ and τ isosurfaces are shown in red and blue, respectively. |
| Date | |
| Source | PNG version, made by user WillowW |
| Author | vector graphics: Puck04 |
| Other versions |
|
| SVG development | This diagram was created with Adobe Illustrator. |

Licensing edit
I, the copyright holder of this work, hereby publish it under the following license:

|
Permission is granted to copy, distribute and/or modify this document under the terms of the GNU Free Documentation License, Version 1.2 or any later version published by the Free Software Foundation; with no Invariant Sections, no Front-Cover Texts, and no Back-Cover Texts. A copy of the license is included in the section entitled GNU Free Documentation License. |
If this file is eligible for relicensing, it may also be used under the Creative Commons Attribution-ShareAlike 3.0 license. The relicensing status of this image has not yet been reviewed. You can help.
|
File history
Click on a date/time to view the file as it appeared at that time.
| Date/Time | Thumbnail | Dimensions | User | Comment | |
|---|---|---|---|---|---|
| current | 18:20, 27 July 2021 | | 700 × 700 (14 KB) | Puck04 (talk | contribs) | == {{int:filedesc}} == {{Information |Description={{en|1=Illustration of the bipolar coordinate system.<p>'''σ''' is the angle between the two foci and the point in question, whereas '''τ''' is the logarithm of the ratio of the distances. The corresponding '''σ''' and '''τ''' isosurfaces are shown in red and blue, respectively.}} |Source=PNG version, made by user WillowW |Date=2021-07-27 |Author=vector graphics: [... |
You cannot overwrite this file.
File usage on Commons
The following page uses this file:
File usage on other wikis
The following other wikis use this file:
- Usage on en.wikipedia.org
- Usage on es.wikipedia.org