File:Circle with overlapping manifold charts.svg

Size of this PNG preview of this SVG file: 300 × 300 pixels. Other resolutions: 240 × 240 pixels | 480 × 480 pixels | 768 × 768 pixels | 1,024 × 1,024 pixels | 2,048 × 2,048 pixels.
Original file (SVG file, nominally 300 × 300 pixels, file size: 15 KB)
Captions
Captions
Add a one-line explanation of what this file represents
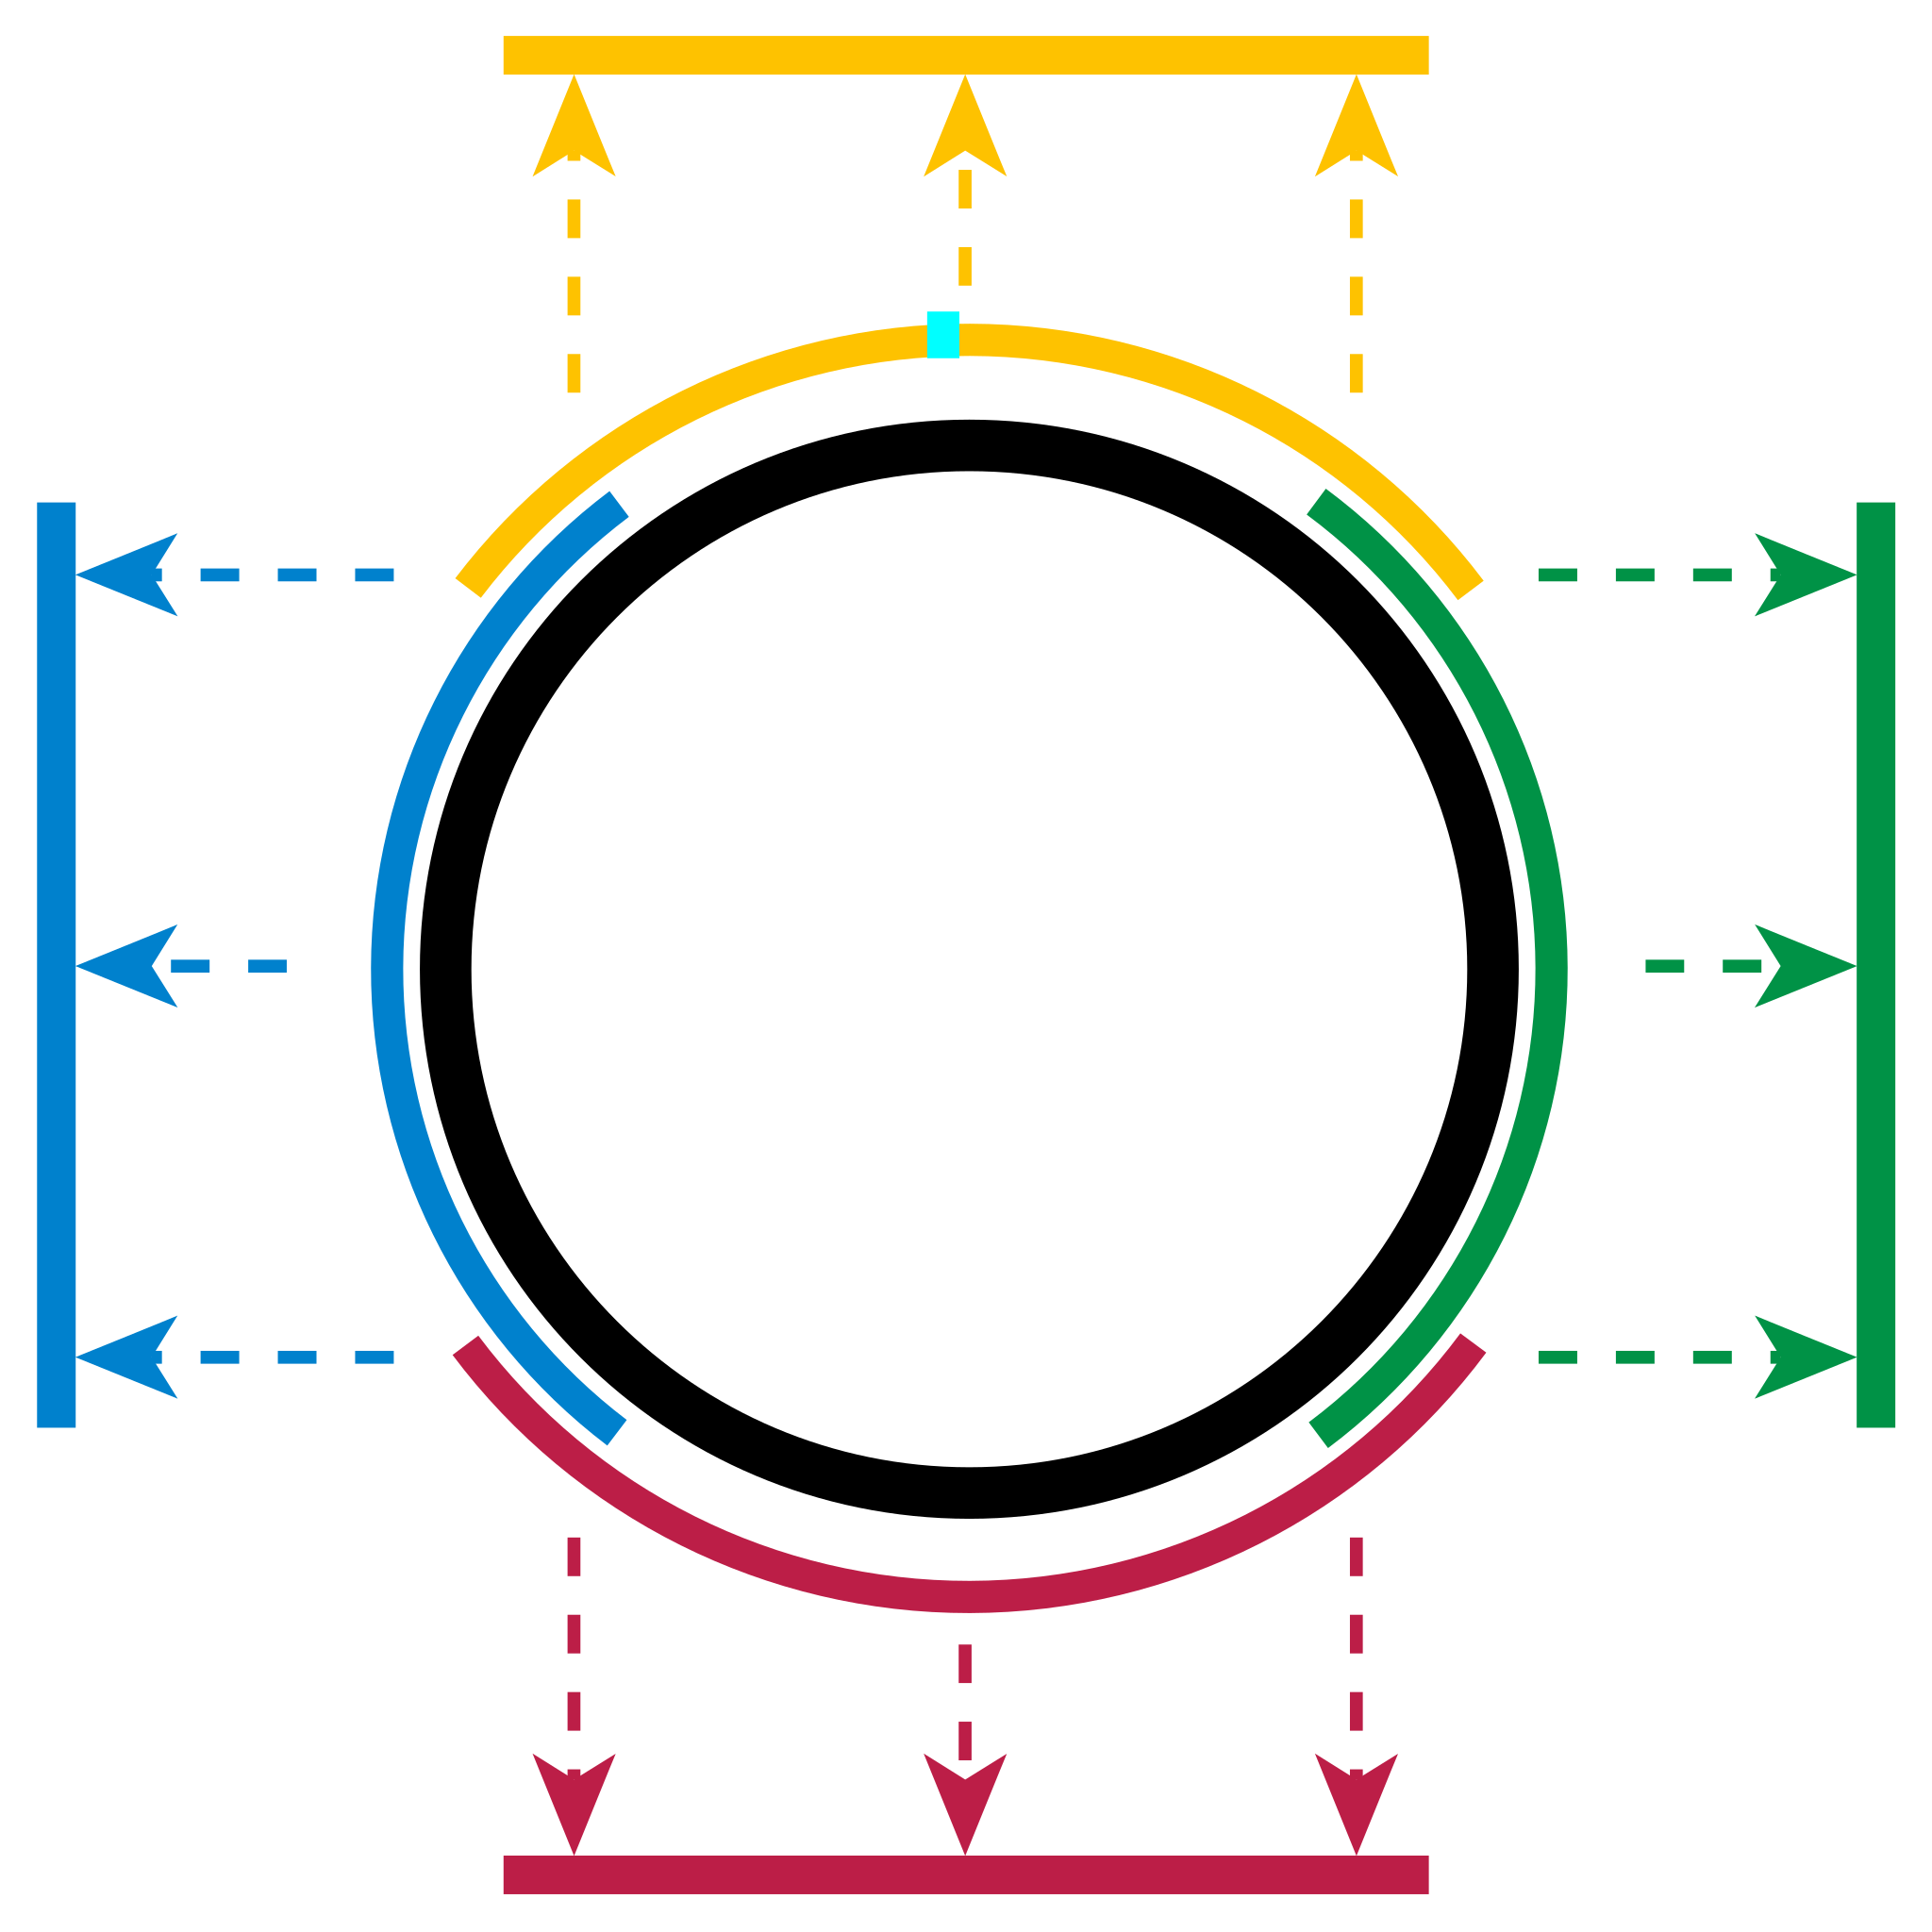
| Description | Circle with example manifold charts, showing four overlapping half-space projections: top (+y), bottom (−y), left (−x), right (+x) |
| Date | (UTC) |
| Source | |
| Author |
|
| This is a retouched picture, which means that it has been digitally altered from its original version. Modifications: Redrawn to SVG format; resized. The original can be viewed here: Circle with overlapping manifold charts.png:
|
This file is licensed under the Creative Commons Attribution-Share Alike 3.0 Unported license.
- You are free:
- to share – to copy, distribute and transmit the work
- to remix – to adapt the work
- Under the following conditions:
- attribution – You must give appropriate credit, provide a link to the license, and indicate if changes were made. You may do so in any reasonable manner, but not in any way that suggests the licensor endorses you or your use.
- share alike – If you remix, transform, or build upon the material, you must distribute your contributions under the same or compatible license as the original.
Original upload log edit
This image is a derivative work of the following images:
- Image:Circle_with_overlapping_manifold_charts.png licensed with Cc-by-sa-2.5
- 2005-08-01T19:18:49Z KSmrq 1000x1000 (51024 Bytes) {{cc-by-sa-2.5}} PNG file created as SVG, rendered by Batik, and uploaded by author. Circle with example manifold charts, showing four, overlapping, half-space projections: top (+y), bottom (-y), left (-x), right (+x). [[C
Uploaded with derivativeFX
File history
Click on a date/time to view the file as it appeared at that time.
| Date/Time | Thumbnail | Dimensions | User | Comment | |
|---|---|---|---|---|---|
| current | 20:30, 10 July 2008 | | 300 × 300 (15 KB) | Pbrks (talk | contribs) | {{Information |Description=Circle with example manifold charts, showing four overlapping half-space projections: top (+y), bottom (−y), left (−x), right (+x) |Source=*Image:Circle_with_overlapping_manifold_charts.png |Date=2008-07-10 20:29 (UTC) |
You cannot overwrite this file.
File usage on Commons
The following 3 pages use this file:
File usage on other wikis
The following other wikis use this file:
- Usage on ar.wikipedia.org
- Usage on ca.wikipedia.org
- Usage on el.wikipedia.org
- Usage on en.wikipedia.org
- Usage on en.wikiversity.org
- Usage on fa.wikipedia.org
- Usage on gl.wikipedia.org
- Usage on id.wikipedia.org
- Usage on it.wikipedia.org
- Usage on ko.wikipedia.org
- Usage on nl.wikipedia.org
- Usage on no.wikipedia.org
- Usage on pl.wikipedia.org
- Usage on pt.wikipedia.org
- Usage on th.wikipedia.org
- Usage on zh-yue.wikipedia.org