File:Cologne population.svg

Size of this PNG preview of this SVG file: 800 × 400 pixels. Other resolutions: 320 × 160 pixels | 640 × 320 pixels | 1,024 × 512 pixels | 1,280 × 640 pixels | 2,560 × 1,280 pixels.
Original file (SVG file, nominally 800 × 400 pixels, file size: 35 KB)
Captions
Captions
Add a one-line explanation of what this file represents
Summary edit
| Description |
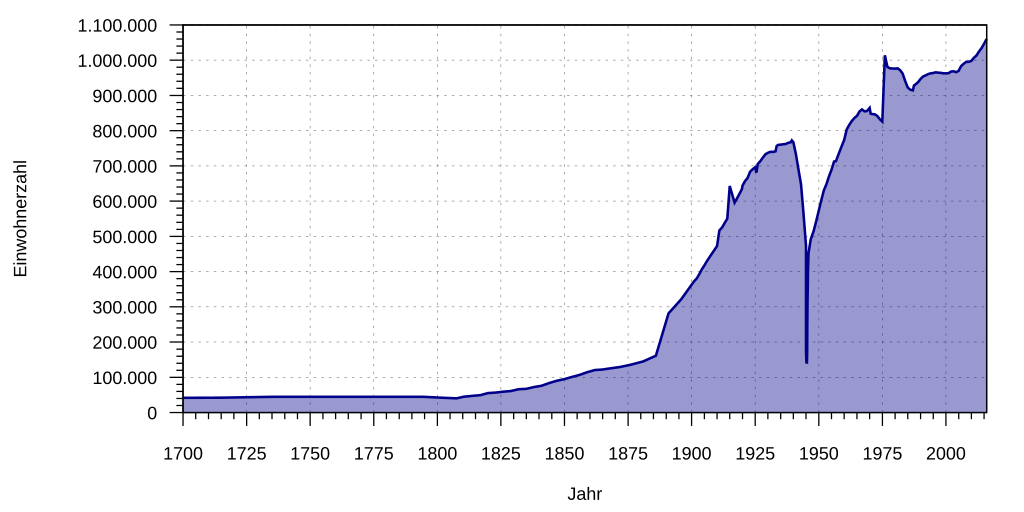
English: Cologne population statistics, since 1700
Deutsch: Einwohnerentwicklung von Köln seit 1700 |
| Date | |
| Source | Own work; data from Einwohnerentwicklung von Köln |
| Author | Gorgo |
Licensing edit
I, the copyright holder of this work, hereby publish it under the following license:
| This file is made available under the Creative Commons CC0 1.0 Universal Public Domain Dedication. | |
| The person who associated a work with this deed has dedicated the work to the public domain by waiving all of their rights to the work worldwide under copyright law, including all related and neighboring rights, to the extent allowed by law. You can copy, modify, distribute and perform the work, even for commercial purposes, all without asking permission.
|
Gnuplot script to generate this plot edit
This plot was created with Gnuplot.
#!/usr/bin/gnuplot
# gnuplot


# Allgemeines zu den Eingabedaten
set timefmt "%d.%m.%Y"     # Zeitangaben in TT.MM.YYYY
set datafile separator ";" # Spaltenseparator


# Allgemeines zur Ausgabe
unset key
set style data lines
set style fill transparent solid 0.4
set grid


# Bereiche/Format/etc X-Achse
set xdata time
set xlabel 'Jahr'
set xrange ['01.01.1700':'31.12.2015']
set xtics '01.01.1000', 60 * 60 * 24 * 365.25 * 25
                      #  xtics in Sekunden
                      # der Beginn der X-Einteilung kann außerhalb xrange
                      # liegen
set mxtics 5          # Unterteilung der Skalierung
set xtics nomirror    # Nur unten Skalieren
set format x '%Y'     # Beschriftungsformat JJJJ
set xtics  out        # Skal. aussen da sie sonst von Grafik überschr. wird


# Bereiche/Format/etc Y-Achse
set ylabel 'Einwohnerzahl'
set yrange [0:]
set ytics 100000
set mytics 5
set ytics nomirror
set decimalsign locale "de_DE.utf8"
set decimal     locale "de_DE.utf8"
set format y  "%'.0f" # Ausgabeformat
set ytics  out        # Skal. aussen da sie sonst von Grafik überschr. wird


# Ausgabeformat: Wir erzeugen SVG
# Die Ausgabedaten leiten wir in eine Pipe und sind so bei Namen der
# Ausgabedatei flexibel (Aufruf: Progname.plt > Ausgabe-svg)
set term svg size 800,400 font "Arial,14"
# keine "set output '<Dateiname>'" Angabe


# Erzeugen der Ausgabe (zum Anlegen der Datei 'daten.scv' siehe unten)
plot './daten.csv' using 1:($2) with filledcurves below x1 lt rgb 'dark-blue' lw 2
Daten edit
Die folgenden Daten bitte in eine Textdatei unter dem Namen daten.csv abspeichern und ins gleiche Verzeichnis wie das GnuPlot-Script ablegen.
#
# Quelle:
# https://de.wikipedia.org/wiki/Einwohnerentwicklung_von_K%C3%B6ln
#
#
30.06.50  ;30000
30.06.250 ;15000
30.06.350 ;15000
30.06.1140;20000
30.06.1430;40000
30.06.1600;40000
# Irgendwer hat festgelegt, dass Daten vor dem
# Jahr 1700 nicht geplotet werden. Grund?
30.06.1714;42015
30.06.1735;44568
30.06.1794;44512
30.06.1801;42024
30.06.1807;40400
30.06.1810;45029
01.12.1816;49276
01.12.1819;55355
01.12.1822;56527
01.12.1825;59049
01.12.1828;61059
01.12.1831;65953
03.12.1834;67302
03.12.1837;72237
03.12.1840;75858
03.12.1843;83418
03.12.1846;90246
03.12.1849;94789
03.12.1852;101091
03.12.1855;106852
03.12.1858;114477
03.12.1861;120568
03.12.1864;122162
03.12.1867;125172
01.12.1871;129233
01.12.1875;135371
01.12.1880;144772
01.12.1885;161401
01.12.1890;281681
02.12.1895;321564
01.12.1900;372229
31.12.1901;380518
31.12.1902;392882
31.12.1903;406420
31.12.1904;417480
01.12.1905;428722
31.12.1906;440376
31.12.1907;451134
31.12.1908;461891
31.12.1909;472649
01.12.1910;516527
31.12.1911;525671
31.12.1912;538302
31.12.1913;550540
31.12.1914;642848
01.12.1916;595853
05.12.1917;609244
08.10.1919;633904
31.12.1919;644206
31.12.1920;657175
31.12.1921;665629
31.12.1922;683363
31.12.1923;690605
31.12.1924;696168
16.06.1925;680704
31.12.1925;705477
31.12.1926;713633
31.12.1927;723753
31.12.1928;733075
31.12.1929;736914
31.12.1930;740082
31.12.1931;739726
31.12.1932;741283
16.06.1933;756605
31.12.1933;759648
31.12.1934;760422
31.12.1935;761263
31.12.1936;762154
31.12.1937;765468
31.12.1938;767102
17.05.1939;772221
31.12.1939;767222
31.12.1940;733500
31.12.1941;690000
31.12.1942;648200
31.12.1943;561600
31.12.1944;472900
01.01.1945;177700
01.02.1945;152000
01.03.1945;140000
01.04.1945;169000
01.05.1945;138500
01.06.1945;175000
01.07.1945;250000
01.08.1945;324800
01.09.1945;359200
01.10.1945;398800
01.11.1945;423200
01.12.1945;447000
31.12.1945;453566
29.10.1946;491380
31.12.1946;494815
31.12.1947;515355
31.12.1948;543765
31.12.1949;573557
13.09.1950;594941
31.12.1950;603283
31.12.1951;630232
31.12.1952;647540
31.12.1953;670031
31.12.1954;688765
31.12.1955;712561
25.09.1956;713505
31.12.1956;718722
31.12.1957;737991
31.12.1958;756203
31.12.1959;773280
31.12.1960;803616
06.06.1961;809247
31.12.1961;816542
31.12.1962;827659
31.12.1963;835832
31.12.1964;842061
31.12.1965;854479
31.12.1966;860200
31.12.1967;854717
31.12.1968;855886
31.12.1969;864754
27.05.1970;848352
31.12.1970;847037
31.12.1971;846479
31.12.1972;841537
31.12.1973;832396
31.12.1974;825792
31.12.1975;1013771
31.12.1976;981021
31.12.1977;976761
31.12.1978;976534
31.12.1979;976136
31.12.1980;976694
31.12.1981;971403
31.12.1982;961777
31.12.1983;940663
31.12.1984;922286
31.12.1985;916153
31.12.1986;914336
25.05.1987;928309
31.12.1987;930907
31.12.1988;937482
31.12.1989;946280
31.12.1990;953551
31.12.1991;956690
31.12.1992;960631
31.12.1993;962517
31.12.1994;963817
31.12.1995;965697
31.12.1996;964346
31.12.1997;964311
31.12.1998;962580
31.12.1999;962507
31.12.2000;962884
31.12.2001;967940
31.12.2002;968639
31.12.2003;965954
31.12.2004;969709
31.12.2005;983347
31.12.2006;989766
31.12.2007;995397
31.12.2008;995420
31.12.2009;998105
# Im Aug. 2017 die Werte für 2010 - 2015 hinzu gefügt. Der Wert für 2011 wurde
# ersetzt da mutmaßlich falsch. Quelle: de:Einwohnerentwicklung von Köln#Ab 1990
31.12.2010;1007119
31.12.2011;1013665
31.12.2012;1024373
31.12.2013;1034175
31.12.2014;1046680
31.12.2015;1060582
EOF
File history
Click on a date/time to view the file as it appeared at that time.
| Date/Time | Thumbnail | Dimensions | User | Comment | |
|---|---|---|---|---|---|
| current | 21:19, 5 November 2017 | | 800 × 400 (35 KB) | Summer ... hier! (talk | contribs) | nach Sourcecode Update (Skalierung) |
| 11:54, 16 August 2017 |  | 800 × 400 (36 KB) | Summer ... hier! (talk | contribs) | Tausender Trennzeichen bei Y-Achse | |
| 11:19, 16 August 2017 |  | 800 × 400 (36 KB) | Summer ... hier! (talk | contribs) | Skalierung X-Achse | |
| 22:23, 15 August 2017 |  | 800 × 400 (27 KB) | Summer ... hier! (talk | contribs) | daten 2010 - 2015 | |
| 20:39, 22 July 2016 |  | 800 × 400 (15 KB) | Offnfopt (talk | contribs) | Color fix | |
| 20:36, 22 July 2016 |  | 800 × 400 (15 KB) | Offnfopt (talk | contribs) | Valid SVG | |
| 16:30, 6 March 2011 |  | 800 × 400 (15 KB) | Gorgo (talk | contribs) | == Summary == {{Information |Description={{en|1=Cologne population statistics, since 1700}} {{de|1=Einwohnerentwicklung von Köln seit 1700}} |Source={{own}}; data from de:Einwohnerentwicklung_von_Köln |Author=Gorgo |Date=2011-03-06 | |
You cannot overwrite this file.
File usage on Commons
There are no pages that use this file.