File:Conway's constant.svg

Size of this PNG preview of this SVG file: 600 × 600 pixels. Other resolutions: 240 × 240 pixels | 480 × 480 pixels | 768 × 768 pixels | 1,024 × 1,024 pixels | 2,048 × 2,048 pixels | 694 × 694 pixels.
Original file (SVG file, nominally 694 × 694 pixels, file size: 35 KB)
Captions
Captions
Add a one-line explanation of what this file represents
Summary edit
| Description |
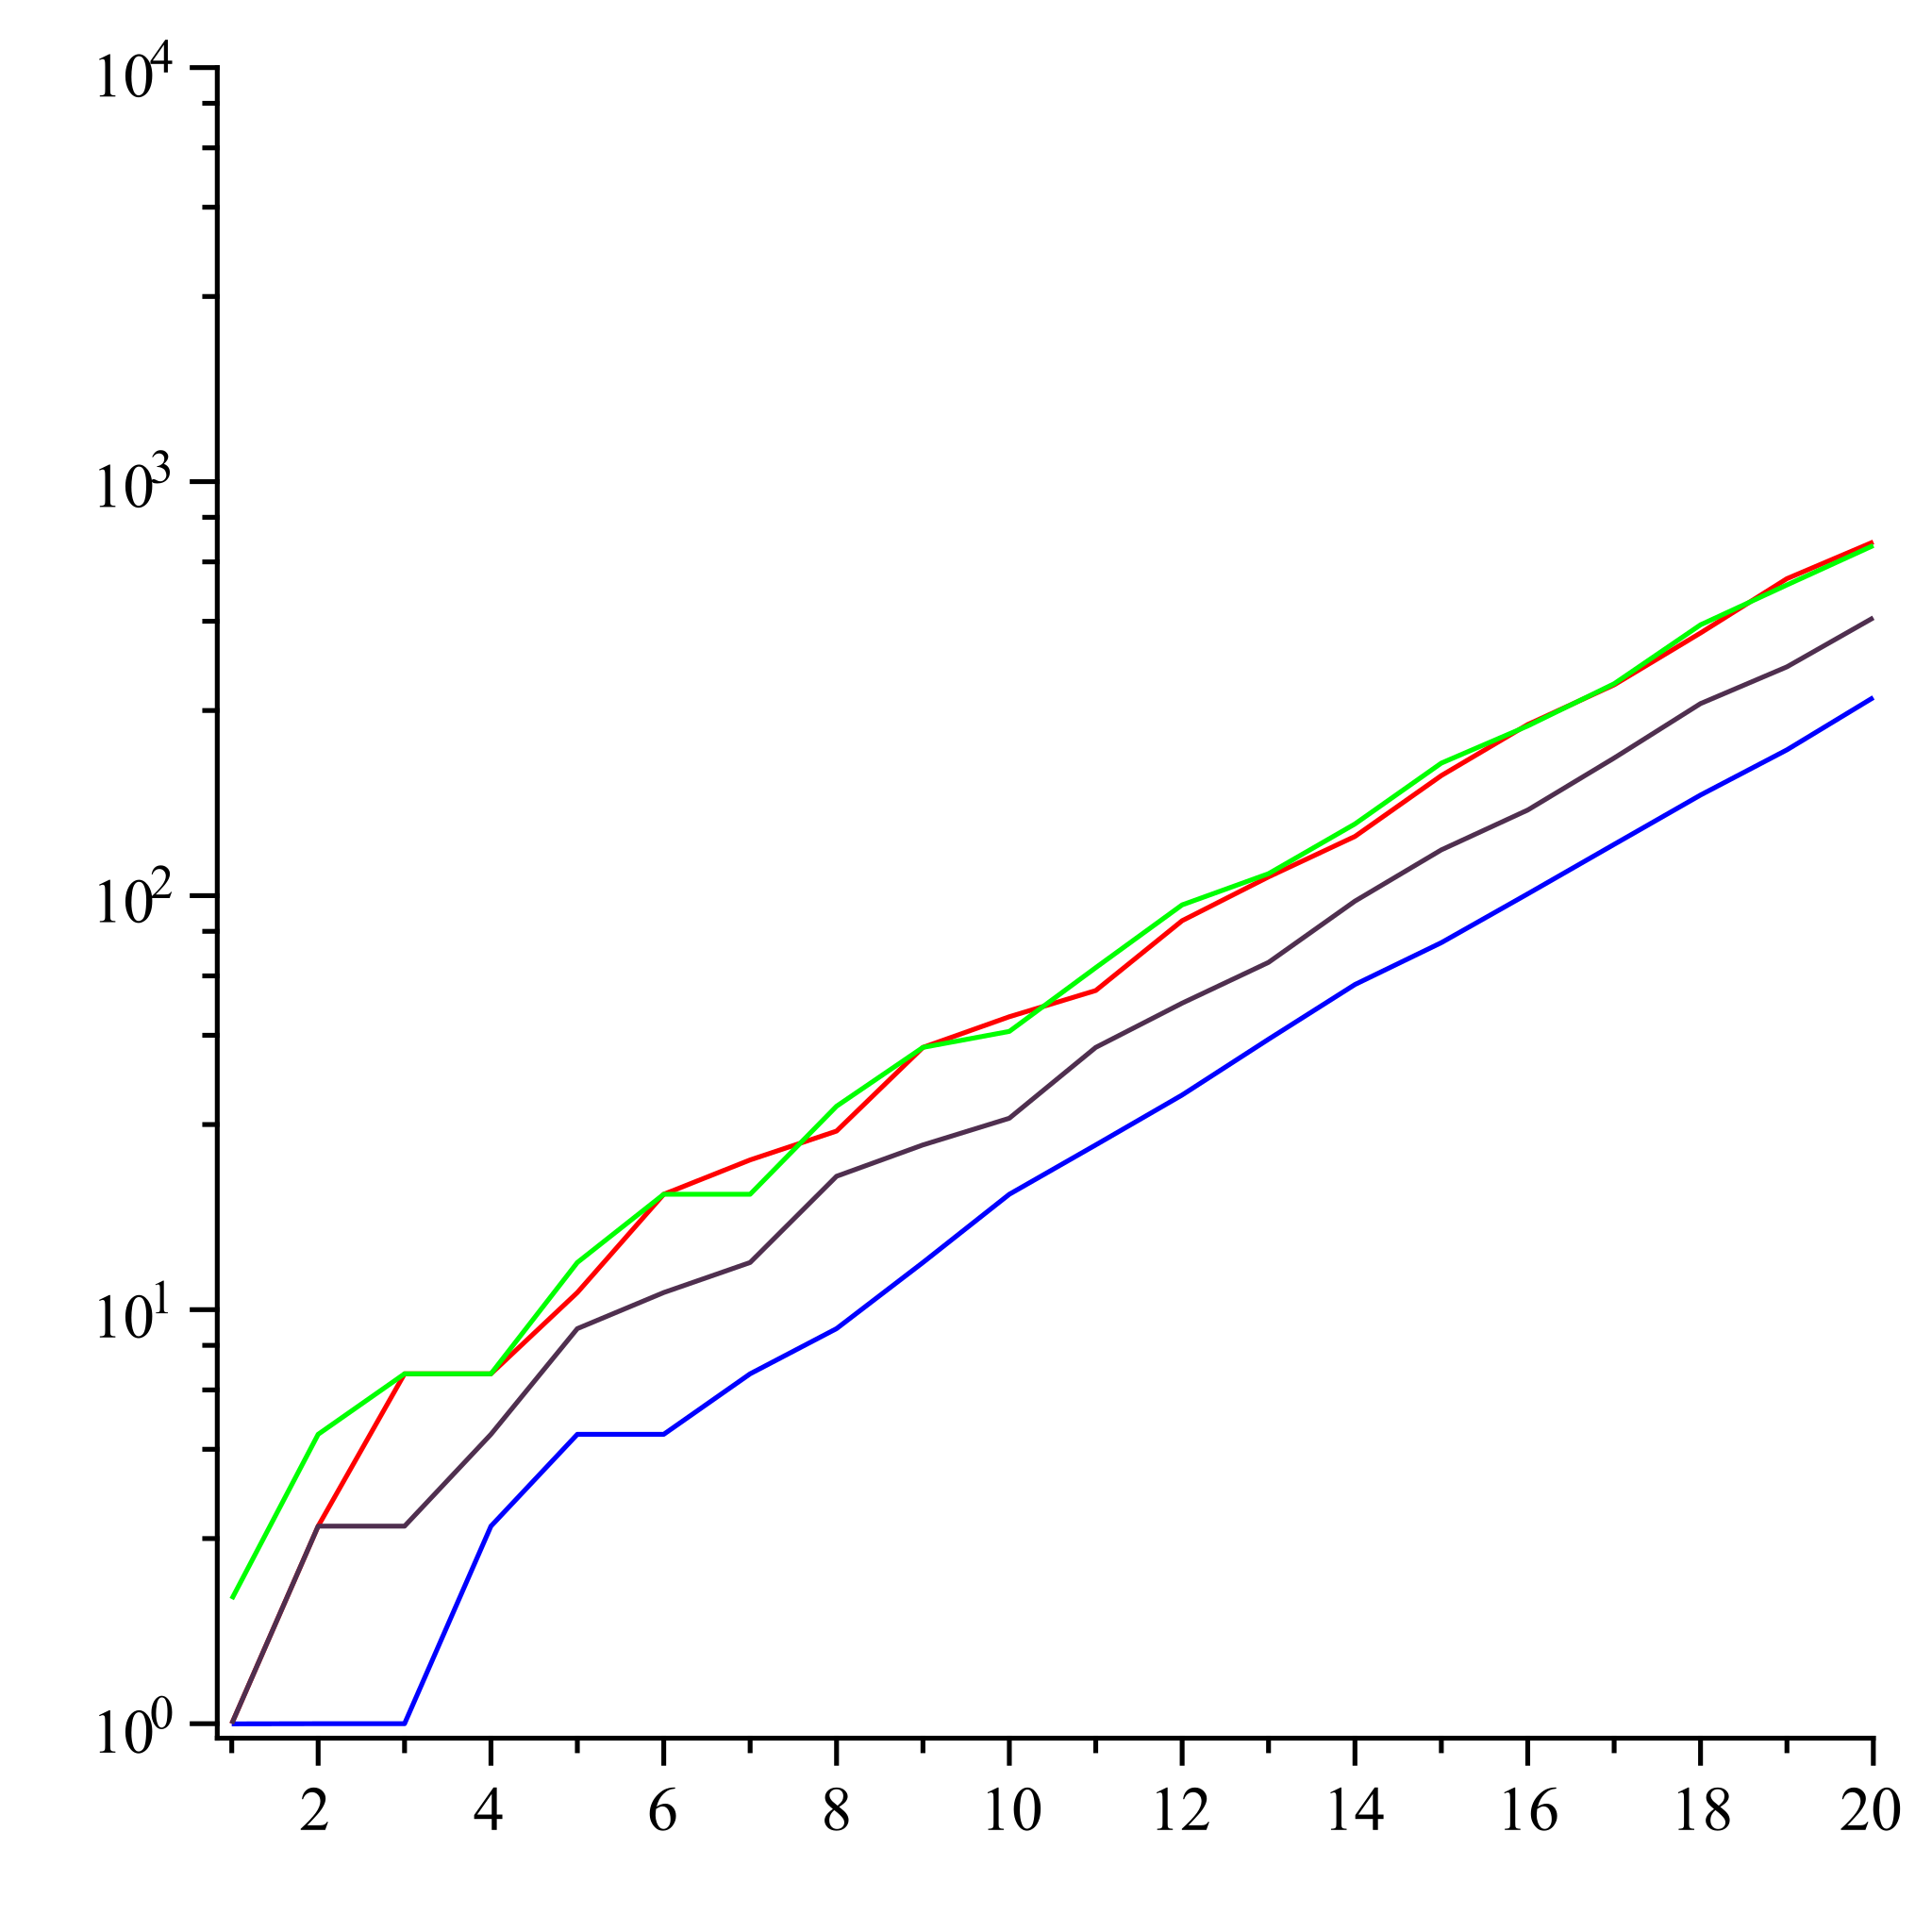
English: The lines show the growth of the numbers of digits in the look-and-say sequences with starting points 23 (red), 1 (blue), 13 (violet), 312 (green). These lines (when represented in a logarithmic scale) tend to straight lines whose slopes coincide with Conway's constant. |
| Date | |
| Source |
Plotted in Maple and converted to SVG format in Inkscape, using the following Maple code: > with(plots); > f := proc (n) options operator, arrow; `mod`(n, 10) end proc; > g := proc (n) options operator, arrow; `mod`(floor((1/10)*n), 10) end proc; > h := proc (n) if 1 <= evalf(log10(n)) then if f(n) = g(n) then return 1+h(floor((1/10)*n)) else return 1 end if else return 1 end if end proc; > k := proc (n) if 0 < n then return f(n)+10*h(n)+10^(floor(log10(f(n)+10*h(n)))+1)*k(floor(n/10^h(n))) else return 0 end if end proc; > sequence := proc (N) local i; for i to 19 do N[i+1] := [][i][2])] end do end proc; > sequencedigits := proc (N) local i; for i to 20 do N[i][2] := floor(log10(N[i][2])) end do end proc; > AA := vector(20); AA[1] := [1, 23]; sequence(AA); sequencedigits(AA); a := logplot(AA, color = red); > BB := vector(20); BB[1] := [1, 1]; sequence(BB); sequencedigits(BB); b := logplot(BB, color = blue); > CC := vector(20); CC[1] := [1, 13]; sequence(CC); sequencedigits(CC); c := logplot(CC, color = violet); > DD := vector(20); DD[1] := [1, 312]; sequence(DD); sequencedigits(DD); d := logplot(DD, color = green); > display(a, b, c, d, view = [1 .. 20, 1 .. 10000]); |
| Author | Sandrobt |
Licensing edit
I, the copyright holder of this work, hereby publish it under the following licenses:
This file is licensed under the Creative Commons Attribution-Share Alike 3.0 Unported license.
- You are free:
- to share – to copy, distribute and transmit the work
- to remix – to adapt the work
- Under the following conditions:
- attribution – You must give appropriate credit, provide a link to the license, and indicate if changes were made. You may do so in any reasonable manner, but not in any way that suggests the licensor endorses you or your use.
- share alike – If you remix, transform, or build upon the material, you must distribute your contributions under the same or compatible license as the original.

|
Permission is granted to copy, distribute and/or modify this document under the terms of the GNU Free Documentation License, Version 1.2 or any later version published by the Free Software Foundation; with no Invariant Sections, no Front-Cover Texts, and no Back-Cover Texts. A copy of the license is included in the section entitled GNU Free Documentation License. |
You may select the license of your choice.
File history
Click on a date/time to view the file as it appeared at that time.
| Date/Time | Thumbnail | Dimensions | User | Comment | |
|---|---|---|---|---|---|
| current | 00:04, 6 February 2011 | | 694 × 694 (35 KB) | Beao (talk | contribs) | Transparent. |
| 19:19, 6 September 2010 |  | 694 × 694 (38 KB) | Sandrobt (talk | contribs) | {{Information |Description={{en|1=The line are the number of digits in the en:look-and-say sequence with starting point 23 (red), 1 (blue), 13 (violet), 312 (green). The lines tend to straight lines whose slopes coincide with Conway's constant.}} |So |
You cannot overwrite this file.
File usage on Commons
There are no pages that use this file.
File usage on other wikis
The following other wikis use this file:
- Usage on en.wikipedia.org
- Usage on fr.wikipedia.org
- Usage on he.wikipedia.org
- Usage on it.wikipedia.org
- Usage on ja.wikipedia.org
- Usage on ko.wikipedia.org
- Usage on ru.wikipedia.org
- Usage on www.wikidata.org