File:Critical 1000-vertex Erdős–Rényi–Gilbert graph.svg

Size of this PNG preview of this SVG file: 600 × 600 pixels. Other resolutions: 240 × 240 pixels | 480 × 480 pixels | 768 × 768 pixels | 1,024 × 1,024 pixels | 2,048 × 2,048 pixels | 1,000 × 1,000 pixels.
Original file (SVG file, nominally 1,000 × 1,000 pixels, file size: 79 KB)
Captions
Captions
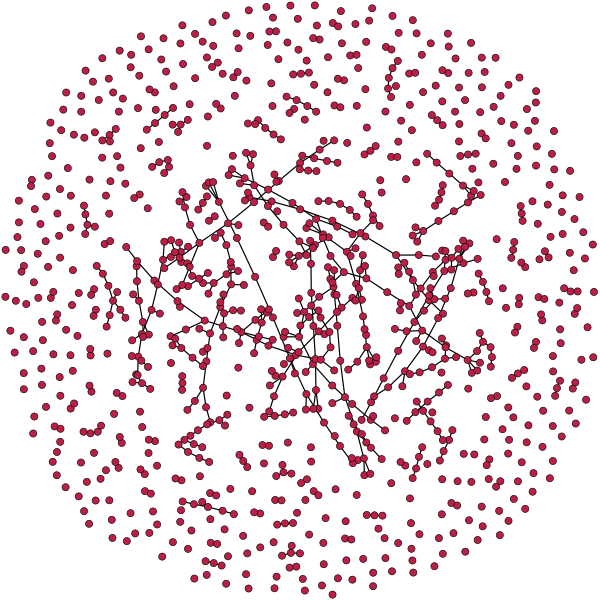
An Erdős–Rényi–Gilbert graph with 1000 vertices at the critical edge probability
Summary edit
| Description |
English: An Erdős–Rényi–Gilbert random graph with 1000 vertices at the critical edge probability , showing the largest connected component in the center. |
| Date | |
| Source | Own work |
| Author | David Eppstein |

Licensing edit
I, the copyright holder of this work, hereby publish it under the following license:
| This file is made available under the Creative Commons CC0 1.0 Universal Public Domain Dedication. | |
| The person who associated a work with this deed has dedicated the work to the public domain by waiving all of their rights to the work worldwide under copyright law, including all related and neighboring rights, to the extent allowed by law. You can copy, modify, distribute and perform the work, even for commercial purposes, all without asking permission.
|
Source code edit
from PADS.SVG import *
from PADS.StrongConnectivity import *
from random import random
from sys import stdout

# ===================================================
# Generate a random graph and random layout
# ===================================================

n = 1000
vertices = range(n)
edgeprob = 1./(n-1)

halfG = {v : set(w for w in vertices if v<w and random() < edgeprob) for v in vertices}
G = {v : set(w for w in vertices if v in halfG[w] or w in halfG[v]) for v in vertices}

# ===================================================
# Pull giant component in and push all the rest out
# ===================================================
weight = {}
SCC = StronglyConnectedComponents(G)
giant = max(len(C) for C in SCC)
for C in StronglyConnectedComponents(G):
    for v in C:
        if len(C) == giant:
            weight[v] = giant
        else:
            weight[v] = -1

# ===================================================
# Social gravity
# ===================================================

D = {v : (random()-0.5) + 1j* (random()-0.5) for v in vertices}
natlength = n**(-0.5)
iterations = 150
increment = 0.01

for i in range(iterations):
    social = 0.25
    forces = {v : -D[v]*social for v in vertices}

    for v in vertices:
        for w in vertices:
            if v != w:
                forces[v] += (natlength/abs(D[v]-D[w]))**2*(D[v]-D[w])

    for v in vertices:
        for w in G[v]:
            forces[v] += abs(D[v]-D[w])*(D[w]-D[v])/natlength

    for v in vertices:
        D[v] += increment * forces[v]

# ===================================================
# Renormalize
# ===================================================

minx = min(D[v].real for v in vertices)
miny = min(D[v].imag for v in vertices)
offset = minx + 1j*miny
for v in vertices:
    D[v] -= offset

maxx = max(D[v].real for v in vertices)
maxy = max(D[v].imag for v in vertices)
rescale = 1./max(maxx,maxy)
for v in vertices:
    D[v] *= rescale

# ===================================================
# Turn layout into drawing
# ===================================================

scale = 1000
radius = 6
margin = 9
bbox = scale*(1+1j)

def place(v):
    return D[v]*(scale-2*margin) + margin*(1+1j)

drawing = SVG(bbox,stdout)

drawing.group(style={"stroke":"#000","stroke-width":"2"})
for v in vertices:
    for w in halfG[v]:
        drawing.segment(place(v),place(w))
drawing.ungroup()

drawing.group(fill=colors.red,stroke=colors.black)
for v in vertices:
    drawing.circle(place(v),radius)
drawing.ungroup()

drawing.close()
File history
Click on a date/time to view the file as it appeared at that time.
| Date/Time | Thumbnail | Dimensions | User | Comment | |
|---|---|---|---|---|---|
| current | 07:33, 9 February 2022 | | 1,000 × 1,000 (79 KB) | David Eppstein (talk | contribs) | Uploaded own work with UploadWizard |
You cannot overwrite this file.
File usage on Commons
The following page uses this file:
File usage on other wikis
The following other wikis use this file:
- Usage on en.wikipedia.org