File:Desommation trois pics gaussiens.svg

Size of this PNG preview of this SVG file: 610 × 460 pixels. Other resolutions: 318 × 240 pixels | 637 × 480 pixels | 1,019 × 768 pixels | 1,280 × 965 pixels | 2,560 × 1,930 pixels.
Original file (SVG file, nominally 610 × 460 pixels, file size: 128 KB)
Captions
Captions
Add a one-line explanation of what this file represents
Summary edit
| Description |
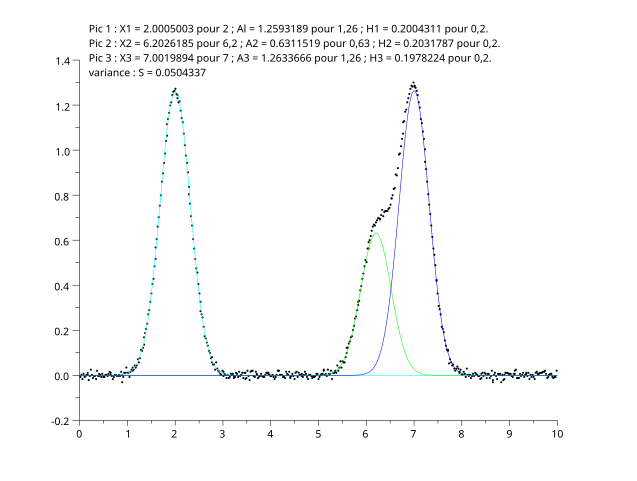
English: Desummation of three gaussian peaks from a noisy signal. The data are retrieved from File:Detection pic savitzky Golay.svg: noisy signal data file, and initial parameters of the model (from the Savitzky-Golay analysis).
Created with Scilab, modified with Inkscape.
Français : Désommation de trois pics gaussiens à partir d'un signal bruité. Les données sont obtenues de File:Detection pic savitzky Golay.svg : fichier de données, et valeurs initiales des paramètres du modèle (à partir de l'analyse de Savitzky-Golay).
Généré par Scilab, modifié avec Inkscape. |
| Date | |
| Source | Own work |
| Author | Christophe Dang Ngoc Chan (cdang) |
Scilab source
 |
This media was created with Scilab, a free open-source software. Here is a listing of the Scilab source used to create this file. |
English: English version by default.
Français : Version française, si les préférences de votre compte sont réglées (voir Special:Preferences).
// **********
// Initialisation
// **********

clear;
clf;
chdir('C:\Documents and Settings\christophe.dang\My Documents\documentation\algo\regression\');

// **********
// Constants
// **********

// Initial parameter of the model
// obtained by Savitzky-Golay
// x position estimated by the minima of the second derivative
// height H by the height of the curve at these positions
// full-width at half maximum FWHM by the length of the chord
// that links the inflection points (extrema of the derivative)
// sigma = FWHM/2,35
Ainit = [1.96 ; 1.26 ; 0.29
6.12 ; 0.64 ; 0.20
7.06 ; 1.27 ; 0.26];

// **********
// Functions
// **********

// Gaussian function

function [y] = gauss(A, x)
    // A(1): peak position
    // A(2): peak height
    // A(3): peak "width"
    y = A(2)*exp(-(x - A(1)).^2/A(3));
endfunction

function [y] = profil(A, x)
    // A(1): 1st peak position
    // A(2): 1st peak height
    // A(3): 1st peak "width"
    // A(4)-A(6): same, 2nd pic
    // A(7)-A(9): same, 3rd pic
    G1 = A(1:3);
    G2 = A(4:6);
    G3 = A(7:9);
    y = gauss(G1, x) + gauss(G2, x) + gauss(G3, x);
endfunction

// Residual

function [e] = res(A, x, y)
    e = profil(A, x) - y;

endfunction

// **********
// Main program
// **********

// Data reading

data = read('three_gaussian_peaks.txt', -1, 2)
X = data(:,1);
Y = data(:,2);

[S, Aopt] = leastsq(list(res, X, Y), Ainit)
Yopt = profil(Aopt, X);
YGopt1 = gauss(Aopt(1:3),X);
YGopt2 = gauss(Aopt(4:6),X);
YGopt3 = gauss(Aopt(7:9),X);

// Display

plot2d(X, Y, style=0)
//plot(X, Yopt, "-r")
plot(X, YGopt1, "-c")
plot(X, YGopt2, "-g")
plot(X, YGopt3, "-b")

height = max(Y);
xmin = min(X)

xstring(xmin, height,...
 'Pic 1 : X1 = '+string(Aopt(1))+' pour 2'...
+' ; Al = '+string(Aopt(2))+' pour 1,26'...
+' ; H1 = '+string(Aopt(3))+' pour 0,2.')
xstring(xmin, 0.95*height,...
 'Pic 2 : X2 = '+string(Aopt(4))+' pour 6,2'...
+' ; A2 = '+string(Aopt(5))+' pour 0,63'...
+' ; H2 = '+string(Aopt(6))+' pour 0,2.')
xstring(xmin, 0.9*height,...
 'Pic 3 : X3 = '+string(Aopt(7))+' pour 7'...
+' ; A3 = '+string(Aopt(8))+' pour 1,26'...
+' ; H3 = '+string(Aopt(9))+' pour 0,2.')
xstring(xmin, 0.85*height,...
 'variance : S = '+string(S))
Licensing edit
I, the copyright holder of this work, hereby publish it under the following licenses:

|
Permission is granted to copy, distribute and/or modify this document under the terms of the GNU Free Documentation License, Version 1.2 or any later version published by the Free Software Foundation; with no Invariant Sections, no Front-Cover Texts, and no Back-Cover Texts. A copy of the license is included in the section entitled GNU Free Documentation License. |
This file is licensed under the Creative Commons Attribution-Share Alike 3.0 Unported, 2.5 Generic, 2.0 Generic and 1.0 Generic license.
- You are free:
- to share – to copy, distribute and transmit the work
- to remix – to adapt the work
- Under the following conditions:
- attribution – You must give appropriate credit, provide a link to the license, and indicate if changes were made. You may do so in any reasonable manner, but not in any way that suggests the licensor endorses you or your use.
- share alike – If you remix, transform, or build upon the material, you must distribute your contributions under the same or compatible license as the original.
You may select the license of your choice.
File history
Click on a date/time to view the file as it appeared at that time.
| Date/Time | Thumbnail | Dimensions | User | Comment | |
|---|---|---|---|---|---|
| current | 14:17, 12 November 2012 | | 610 × 460 (128 KB) | Cdang (talk | contribs) | {{Information |description= {{en|1=Desummation of three gaussian peaks from a noisy signal. The data are retrieved from File:Detection pic savitzky Golay.svg: noisy signal data file, and initial parameters of the model (from the Savitzky-Golay ana... |
You cannot overwrite this file.
File usage on Commons
There are no pages that use this file.