File:Dft visualization rev2 n0008 trimmed.svg

Size of this PNG preview of this SVG file: 593 × 600 pixels. Other resolutions: 237 × 240 pixels | 475 × 480 pixels | 759 × 768 pixels | 1,013 × 1,024 pixels | 2,025 × 2,048 pixels | 1,246 × 1,260 pixels.
Original file (SVG file, nominally 1,246 × 1,260 pixels, file size: 500 KB)
Captions
Captions
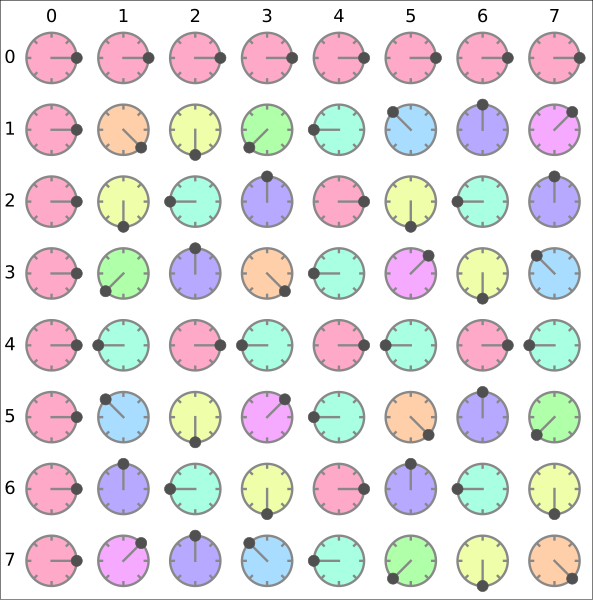
Visual depiction of the matrix of the DFT for N=8
Summary edit
| Description |
English: Depiction of the matrix of the DFT for N=8. Each element is represented by a picture of its location in the complex plane in relation to the unit circle. The values are also coded in the shading of the unit disk. Generated by the following Python code.
from numpy import linspace,ones_like,real,imag,cos,sin,pi,exp,arange,mod
import matplotlib.pyplot as plt
from matplotlib import cm

def fft_matrix_viz(n):
    L = 1.
    vsep = -1.
    lwfac = 4
    markersize = 75./float(n)/2 *lwfac
    i = complex(0.,1.)
    t = linspace(0,L,501,endpoint=True)
    kvals = range(0,n)#-n//2,n)
    colormap = cm.get_cmap('hsv') # a cyclic colormap
    nc = len(kvals)
    cmrotation = 0.95 #0.8  #0.05
    colors = colormap( mod( linspace(0,1,nc,endpoint=False) + cmrotation, 1 ) )  # get nc colors from the colormap
    # pastelize colors
    p = 0.55
    colors = (1-p)*colors + p*ones_like(colors)
    # darken colors
    d = 1 #0.9
    colors *= [d,d,d,1]
    clockcolor = '#888888'
    fontsize = 20*4/n*1.5*2
    figsize = 20
    plt.figure(figsize=(figsize,figsize))

    theta = linspace(0,2*pi,100)
    c = cos(theta)
    s = sin(theta)
    def plotZ(x,y,Z):
        radius = 0.35
        tickfraci = 0.15
        tickfraco = 0.05
        color = colors[(j*k)%len(kvals)]
        plt.fill(x+radius*c, y+radius*s,color=color,alpha=.75)  # fill unit circle
        plt.plot(x+radius*c, y+radius*s,color=clockcolor,lw=lwfac,alpha=1)#0.35)  # draw unit circle
        for ticktheta in linspace(0,2*pi,n,endpoint=False):  # draw ticks
            tc,ts = cos(ticktheta),sin(ticktheta)
            plt.plot([x+(1-tickfraci)*radius*tc,x+(1-tickfraco)*radius*tc],[y+(1-tickfraci)*radius*ts,y+(1-tickfraco)*radius*ts],color=clockcolor,lw=lwfac,alpha=1)#0.35)
        plt.plot([x,x+radius*real(Z)],[y,y+radius*imag(Z)],color=clockcolor,lw=lwfac,alpha=1)#0.35) # draw radius
        plt.plot(x+radius*real(Z),y+radius*imag(Z),'o',markersize=markersize,color='#505050',alpha=1) # mark Z

    plt.subplot(1,1,1,aspect=1,frameon=False)
    for k in kvals:
        zd = exp(-2*pi*i*k*arange(n)/float(n))
        for j,Z in enumerate(zd): plotZ(j,vsep*k,Z)
        plt.text(-0.5,vsep*k,str(k),va='center',ha='right',fontsize=fontsize)

    for j in range(n):
        plt.text(j,vsep*(min(kvals)-0.50),str(j),ha='center',fontsize=fontsize)
    plt.xlim(-.5,n+.5)
    plt.ylim(vsep*(max(kvals)+1),vsep*(min(kvals)-1))
    plt.xticks([])
    plt.yticks([])

    plt.savefig(f'dft_visualization_rev2_n{str(n).zfill(4)}.svg',bbox_inches='tight')

fft_matrix_viz(8)
|
| Date | |
| Source | Own work |
| Author | Darnling |
Licensing edit
I, the copyright holder of this work, hereby publish it under the following license:
This file is licensed under the Creative Commons Attribution-Share Alike 4.0 International license.
- You are free:
- to share – to copy, distribute and transmit the work
- to remix – to adapt the work
- Under the following conditions:
- attribution – You must give appropriate credit, provide a link to the license, and indicate if changes were made. You may do so in any reasonable manner, but not in any way that suggests the licensor endorses you or your use.
- share alike – If you remix, transform, or build upon the material, you must distribute your contributions under the same or compatible license as the original.
File history
Click on a date/time to view the file as it appeared at that time.
| Date/Time | Thumbnail | Dimensions | User | Comment | |
|---|---|---|---|---|---|
| current | 15:00, 17 May 2021 | | 1,246 × 1,260 (500 KB) | Darnling (talk | contribs) | Uploaded own work with UploadWizard |
You cannot overwrite this file.
File usage on Commons
The following page uses this file: