File:Diamond-Water paradox.png

Size of this preview: 800 × 600 pixels. Other resolutions: 320 × 240 pixels | 640 × 480 pixels | 1,024 × 768 pixels | 1,200 × 900 pixels.
Original file (1,200 × 900 pixels, file size: 34 KB, MIME type: image/png)
Captions
Captions
Add a one-line explanation of what this file represents
| Description |
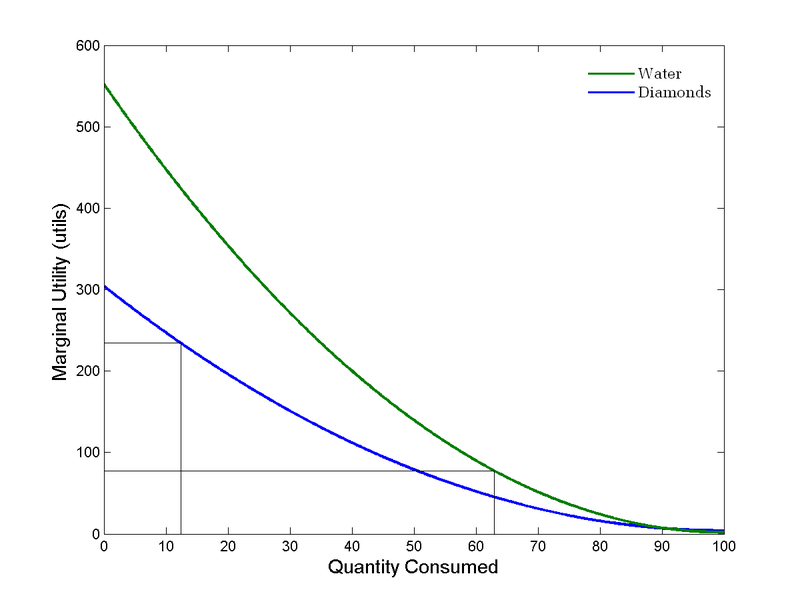
This graph shows the marginal utility (measured in en:utils) of en:diamonds and en:water as a function of the amount consumed. As a person consumes (buys) more and more diamonds or water each additional unit of diamonds or water results in a lower marginal utility. This is phenomenon is known as the law of diminishing marginal utility. The graph makes it clear that person derives much more utility from the first units of water than the first units of diamonds (the first units of water keep the person from dehydrating and thus have a much higher marginal utility). The person, however, is consuming 63 units of water and is only deriving 80 utils of utility for the last unit of water. Meanwhile, the person is consuming just 12 units of diamonds and is deriving 235 utils from the 12th diamond. |
||||||||
| Source | I (Renaissance Man) created this graph in en:MATLAB. It is loosely based on this diagram. Changes can and will be made upon request. | ||||||||
| Author | User Renaissance Man on en.wikipedia | ||||||||
| Permission (Reusing this file) |
Renaissance Man at the English-language Wikipedia, the copyright holder of this work, hereby publishes it under the following license:
This file is licensed under the Creative Commons Attribution-Share Alike 1.0 Generic license.
|
||||||||
| Other versions |
Originally from en.wikipedia; description page is (was) here * 20:45, 27 April 2006 [[:en:User:Renaissance Man|Renaissance Man]] 1200×900 (35,166 bytes) <span class="comment">(==Description== This graph shows the [[:en:marginal utility]] (measured in [[:en:utils]]) of [[:en:diamonds]] and [[:en:water]] as a function of the amount consumbed. As a person consumes (buys) more and more diamonds or water each additional unit of diamonds)</span> |

This diagram was created with MATLAB.

|
This graph image could be re-created using vector graphics as an SVG file. This has several advantages; see Commons:Media for cleanup for more information. If an SVG form of this image is available, please upload it and afterwards replace this template with
{{vector version available|new image name}}.
It is recommended to name the SVG file “Diamond-Water paradox.svg”—then the template Vector version available (or Vva) does not need the new image name parameter. |
File history
Click on a date/time to view the file as it appeared at that time.
| Date/Time | Thumbnail | Dimensions | User | Comment | |
|---|---|---|---|---|---|
| current | 08:49, 22 August 2006 | | 1,200 × 900 (34 KB) | Platonides (talk | contribs) | {{Information| |Description= ==Description== This graph shows the marginal utility (measured in en:utils) of en:diamonds and en:water as a function of the amount consumed. As a person consumes (buys) more and more diamon |
You cannot overwrite this file.
File usage on Commons
There are no pages that use this file.
File usage on other wikis
The following other wikis use this file:
- Usage on az.wikipedia.org
- Usage on en.wikipedia.org
- Usage on es.wikipedia.org
- Usage on hy.wikipedia.org
- Usage on id.wikipedia.org
- Usage on ja.wikipedia.org
- Usage on lt.wikipedia.org
- Usage on nl.wikipedia.org
- Usage on pt.wikipedia.org
- Usage on ru.wikipedia.org
- Usage on uk.wikipedia.org