File:Dirichlet distributions.png

Size of this preview: 695 × 599 pixels. Other resolutions: 278 × 240 pixels | 557 × 480 pixels | 885 × 763 pixels.
Original file (885 × 763 pixels, file size: 191 KB, MIME type: image/png)
File information
Structured data
Captions
Captions
Add a one-line explanation of what this file represents
Summary edit
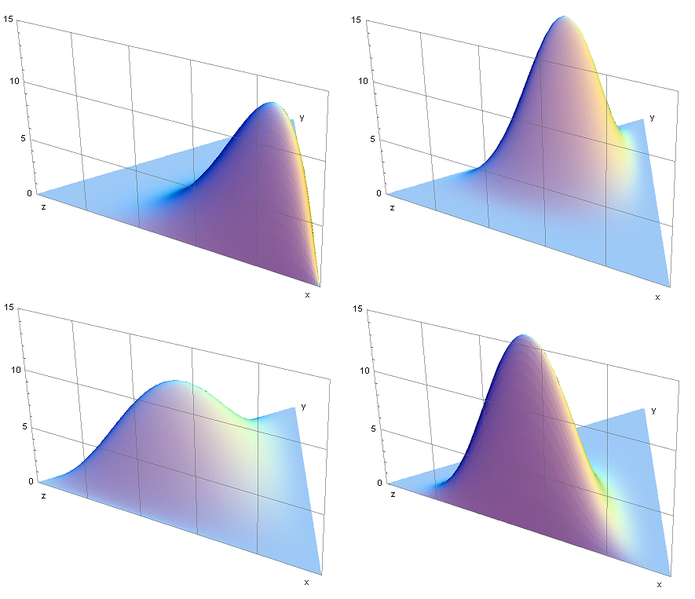
| DescriptionDirichlet distributions.png | Several images of probability densities of the Dirichlet distribution as functions on the 2-simplex. Clockwise from top left: α = (6,2,2), (3,7,5), (6,2,6), (2,3,4). |
| Source |
en:Image:Dirichlet_distributions.png This diagram was created with Mathematica. |
| Author | en:User:ThG |

|
This graph image could be re-created using vector graphics as an SVG file. This has several advantages; see Commons:Media for cleanup for more information. If an SVG form of this image is available, please upload it and afterwards replace this template with
{{vector version available|new image name}}.
It is recommended to name the SVG file “Dirichlet distributions.svg”—then the template Vector version available (or Vva) does not need the new image name parameter. |
Licensing edit
| Public domainPublic domainfalsefalse |
| This work is ineligible for copyright and therefore in the public domain because it consists entirely of information that is common property and contains no original authorship. |
| Public domainPublic domainfalsefalse |
| This work has been released into the public domain by its author, ThG at English Wikipedia. This applies worldwide. In some countries this may not be legally possible; if so: ThG grants anyone the right to use this work for any purpose, without any conditions, unless such conditions are required by law.Public domainPublic domainfalsefalse |
Mathematica Source code edit
(* matrix mapping standard basis in R^2 to two sides of equilateral triangle T *)
M = {{1, Cos[Pi/3]},
     {0, Sin[Pi/3]}};
Mi = Inverse[M];

(* map a point in the triangle T to the corresponding point on the standard 2-simplex S *)
TtoS[xy_] := Module[{p1, p2}, {p1, p2} = Mi . xy; {p1, p2, 1 - p1 - p2}];

(* calculate the probability density as a function on T *)
f[xy_, a_] := Module[{a1, a2, a3, x, y, z, B},
    {a1, a2, a3} = a;
    {x, y, z} = TtoS[xy];
    B = Gamma[a1 + a2 + a3]/(Gamma[a1] * Gamma[a2] * Gamma[a3]);
    B*(x^(a1 - 1))*(y^(a2 - 1))*(z^(a3 - 1))];

(* recursively tesselate triangle (x1, x2, x3) by bisecting its edges and return
   a list of triangles as in input suitable for Graphics3D *)
Tesselate[x1_, x2_, x3_, alpha_] :=
  Module[ {d1 = (x2 - x1), d2 = (x3 - x2), d3 = (x1 - x3), m, g},
    m = Max[{d1.d1, d2.d2, d3.d3}];
    If[ m < 0.0002, (* stop when the length of every edge is below threshold *)
      {{EdgeForm[], (* don't display edges of triangles *)
          Polygon[ {
              {x1[[1]], x1[[2]], f[x1, alpha]},
              {x2[[1]], x2[[2]], f[x2, alpha]},
              {x3[[1]], x3[[2]], f[x3, alpha]}}]}},
      Module[{m1 = .5*(x1 + x2), m2 = .5*(x2 + x3), m3 = .5*(x3 + x1)},
        Join[
          Tesselate[x1, m1, m3, alpha],
          Tesselate[m1, x2, m2, alpha],
          Tesselate[m3, m1, m2, alpha],
          Tesselate[m3, m2, x3, alpha]] ]]]

Show[Graphics3D[Tesselate[{0, 0},  {1, 0}, {Cos[Pi/3], Sin[Pi/3]},
      {7, 2, 3} (* alpha *) ]],
  (* stupid display options *)
  Boxed -> False,
  PlotRange -> { {0, 1}, {0, 1}, {0, 15}},
  AxesEdge -> {None, None, {-1, -1}},
  Axes -> True,
  FaceGrids -> { {0, -1, 0}},
  BoxRatios -> {1, 1, .6}]
File history
Click on a date/time to view the file as it appeared at that time.
| Date/Time | Thumbnail | Dimensions | User | Comment | |
|---|---|---|---|---|---|
| current | 16:52, 2 October 2016 |  | 885 × 763 (191 KB) | Cmdrjameson (talk | contribs) | Compressed with pngout. Reduced by 145kB (43% decrease). |
| 21:00, 14 October 2007 |  | 885 × 763 (337 KB) | Euku (talk | contribs) | {{Information |Description= |Source= |Date= |Author= |Permission= |other_versions= }} == Summary == Several images of probability densities of the Dirichlet distribution as functions on the 2-simplex. Clockwise from top left: ''α'' = (6,2,2), (3,7,5), |
You cannot overwrite this file.
File usage on Commons
The following 2 pages use this file:
File usage on other wikis
The following other wikis use this file:
- Usage on de.wikipedia.org
- Usage on fa.wikipedia.org
- Usage on fr.wikipedia.org
- Usage on ja.wikipedia.org
- Usage on ko.wikipedia.org
- Usage on nl.wikipedia.org
- Usage on pl.wikipedia.org
- Usage on www.wikidata.org