File:Erdgeschichte auf 24 h herunterskaliert.svg

Original file (SVG file, nominally 760 × 667 pixels, file size: 65 KB)
Captions
Captions
Summary edit
| Description |
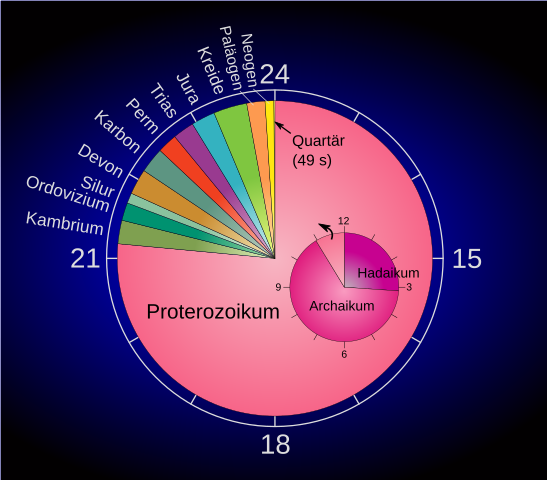
Deutsch: Skalierung der tiefen geologischen Zeit auf 24 Stunden. Zur besseren Lesbarkeit konzentriert sich das Diagramm in der Darstellung vor allem auf die letzten 2,3 Mrd Jahre der Erdgeschichte, herunterskaliert auf die Zeit von 12 Uhr mittags bis 24 Uhr. Die ersten 2,3 Mrd Jahre (entsprechend der Zeit von 0 Uhr bis 12 Uhr mittags) sind in dem Inset veranschaulicht. Man beachte, dass das Proterozoikum, das längste der vier Äonotheme der Geologischen Zeitskala, bereits „vormittags“ beginnt und bis weit in den „Abend“ andauert. |
| Date | |
| Source | inspired by File:Earth clock hg.png |
| Author | Gretarsson |
| SVG development | This diagram was created with Inkscape. This chart was created with LibreOffice Calc. |
Anmerkungen zur Grafik edit
Setzt man den Beginn der erdgeschichtlichen Zeitrechnung bei −4600 Mio Jahren (Ma) an (nach aktuellstem Stand eigentlich −4570 Ma), entsprechen 24 Stunden also 4600 Ma.
Damit ergeben sich folgende Verhältnisse:
1 h	4600 Ma / 24 h		= 191,666667 Ma
1 min	191,666667 Ma / 60 min	= 3,194444 Ma
1 s	3,194444 Ma / 60 s	= 0,053241 Ma = 53,241 ka
Daraus ergibt sich:
1 Ma 1 s / 0,053241 Ma = 18,782609 s.
Somit ergeben sich über die kumulierte Dauer der Einheiten in Ma die heruntergerechneten End-Uhrzeiten dieser Einheiten:
| Zeitalter | Dauer [Ma] | Ende [Ma] | Ende [Tageszeit] |
|---|---|---|---|
| Beginn der Entstehung von Erde und Sonnensystem | 0 | −4600 | 00:00:00 |
| Hadaikum | 600 | −4000 | 03:07:50 |
| Archaikum | 1500 | −2500 | 10:57:23 |
| Proterozoikum (Anteil 1. „Tageshälfte“) | 200 | −2300 | 12:00:00 |
| Proterozoikum (Anteil 2. „Tageshälfte“) | 1759 | −541 | 21:10:39 |
| Kambrium | 55,6 | −485,4 | 21:28:03 |
| Ordovizium | 42 | −443,4 | 21:41:12 |
| Silur | 24,2 | −419,2 | 21:48:46 |
| Devon | 60,3 | −358,9 | 22:07:39 |
| Karbon | 60 | −298,9 | 22:26:26 |
| Perm | 47 | −251,9 | 22:41:09 |
| Trias | 50,6 | −201,3 | 22:56:59 |
| Jura | 56,3 | −145 | 23:14:37 |
| Kreide | 79 | −66 | 23:39:20 |
| Paläogen | 42,97 | −23,03 | 23:52:47 |
| Neogen | 20,442 | −2,588 | 23:59:11 |
| Quartär | 2,588 | 0 | 24:00:00 |
Die Basisgrafiken sind allerdings einfache Tortendiagramme, für die nur die Dauer in Millionen Jahren als Werte verwendet wurden. Sie wurden jeweils als SVG aus LibreOffice Calc exportiert und mit Inkscape weiter bearbeitet.
Licensing edit
- You are free:
- to share – to copy, distribute and transmit the work
- to remix – to adapt the work
- Under the following conditions:
- attribution – You must give appropriate credit, provide a link to the license, and indicate if changes were made. You may do so in any reasonable manner, but not in any way that suggests the licensor endorses you or your use.
- share alike – If you remix, transform, or build upon the material, you must distribute your contributions under the same or compatible license as the original.
File history
Click on a date/time to view the file as it appeared at that time.
| Date/Time | Thumbnail | Dimensions | User | Comment | |
|---|---|---|---|---|---|
| current | 12:00, 10 June 2022 | | 760 × 667 (65 KB) | Gretarsson (talk | contribs) | removed unintentional blur from Proterozoic segment in inset |
| 01:14, 10 June 2022 |  | 760 × 667 (65 KB) | Gretarsson (talk | contribs) | duration of Quaternary corrected // Editing SVG source code using c:User:Rillke/SVGedit.js | |
| 23:35, 9 June 2022 |  | 760 × 667 (65 KB) | Gretarsson (talk | contribs) | {{Information |Description= {{de|1=Skalierung der tiefen geologischen Zeit auf 24 Stunden}} |Source= inspired by File:File:Earth clock hg.png |Date=2022-06-10 |Author={{User:Gretarsson|Gretarsson}} |Permission= |other_versions= }} |
You cannot overwrite this file.
File usage on Commons
The following 2 pages use this file:
File usage on other wikis
The following other wikis use this file:
- Usage on de.wikipedia.org