File:Ethanol fuel k-d tree.png
Ethanol_fuel_k-d_tree.png (513 × 501 pixels, file size: 60 KB, MIME type: image/png)
Captions
Captions

|
This diagram image could be re-created using vector graphics as an SVG file. This has several advantages; see Commons:Media for cleanup for more information. If an SVG form of this image is available, please upload it and afterwards replace this template with
{{vector version available|new image name}}.
It is recommended to name the SVG file “Ethanol fuel k-d tree.svg”—then the template Vector version available (or Vva) does not need the new image name parameter. |
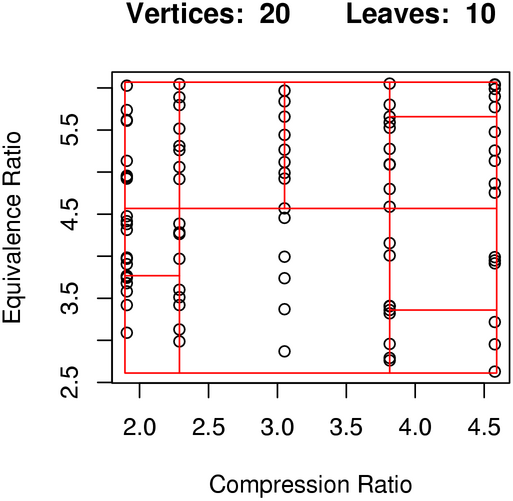
This is a visual representation of a 2-dimensional kd-tree. The tree itself is used to iterpolate a local regression surface. For more information on how image itself was generated, see [1].
The data set used is from Brinkman, N.D.: Ethanol Fuel-A Single-Cylinder Engine Study of Efficiency and Exhaust Emissions. SAE transactions, *90*, 1410-1424. (1981). For more information see also Cleveland, William S: Visualizing Data. Hobart Press, Summit, New Jersey, pages 188-190. (1996).
For more information on how kd-trees are used in local regression, see W. S. Cleveland and C. L. Loader: Smoothing by Local Regression: Principles and Methods, Statistical Theory and Computational Aspects of Smoothing, 10-49, edited by W. Haerdle and M. G. Schimek, Springer, New York, 1996.

|
Permission is granted to copy, distribute and/or modify this document under the terms of the GNU Free Documentation License, Version 1.2 or any later version published by the Free Software Foundation; with no Invariant Sections, no Front-Cover Texts, and no Back-Cover Texts. A copy of the license is included in the section entitled GNU Free Documentation License. |
| This file is licensed under the Creative Commons Attribution-Share Alike 3.0 Unported license. | ||
| ||
| This licensing tag was added to this file as part of the GFDL licensing update. |
File history
Click on a date/time to view the file as it appeared at that time.
| Date/Time | Thumbnail | Dimensions | User | Comment | |
|---|---|---|---|---|---|
| current | 23:07, 10 June 2005 | | 513 × 501 (60 KB) | Btyner (talk | contribs) | This is a visual representation of a 2-dimensional kd-tree. The tree itself is used to iterpolate a local regression surface. For more information on how image itself was generated, see [http://www.stat.purdue.edu/~btyner/packages.html]. The data set use |
You cannot overwrite this file.
File usage on Commons
There are no pages that use this file.