File:Europäische Produktion von gedruckten Büchern ca. 1450–1800.png

Size of this preview: 800 × 543 pixels. Other resolutions: 320 × 217 pixels | 640 × 434 pixels | 1,024 × 695 pixels | 1,404 × 953 pixels.
Original file (1,404 × 953 pixels, file size: 63 KB, MIME type: image/png)
Captions
Captions
Add a one-line explanation of what this file represents
Summary edit
| Description |
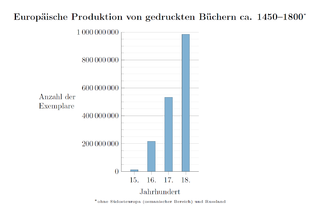
Deutsch: Geschätzte Buchdruckproduktion in Europa von ca. 1450 bis 1800. Ein Buch ist definiert als ein Druckwerk von mehr als 49 Seiten.
English: Estimated output of printed books in Europe from ca. 1450 to 1800. A book is defined as printed matter containing more than 49 pages. |
| Date | |
| Source | Own work |
| Author | Zahlen aus: Eltjo Buringh; Jan Luiten van Zanden: „Charting the “Rise of the West”: Manuscripts and Printed Books in Europe, A Long-Term Perspective from the Sixth through Eighteenth Centuries“, in: The Journal of Economic History, Bd. 69, Nr. 2 (2009), S. 409–445 (417, Tafel 2) |
| Other versions |
|


LaTeX Source edit
\documentclass[border=5mm]{standalone}
\usepackage{pgfplots}
\usepackage[utf8]{inputenc}
\usepackage{amsmath}
\pgfplotstableread{
Century Manuscripts Books
6       13552           nan
7       10639           nan
8       43702           nan
9       201742  nan
10      135637  nan
11      212030  nan
12      768721  nan
13      1761951 nan
14      2746951 nan
15      4999161 12589000
16       nan            217444000
17      nan             531941000
18      nan             983874000
}\datatable

\definecolor{RYB1}{RGB}{128, 177, 211}

\begin{document}
\begin{tikzpicture}
  \begin{axis}[
        x=0.7895cm,
        axis on top=false, grid=both, xmajorgrids=false, xminorgrids=false, every minor grid/.style=gray!20,
        minor y tick num=3,
        axis lines*=left,
        width=12cm, height=8cm, enlarge x limits=0.25,
        ymin=0, ymax=1e9, scaled y ticks=false,
        yticklabel={\pgfmathprintnumber[fixed, set thousands separator=\,]{\tick}},
        enlarge y limits=false,
        ybar=-10pt, xtick={15,...,19}, xticklabel={\pgfmathparse{int(\tick)}\pgfmathresult.},
        xlabel=Jahrhundert, xlabel style={yshift=-1ex},ylabel=Anzahl der\\Exemplare,
         ylabel style={rotate=-90, align=left, anchor=east, xshift=-5ex, name=ylabel},
        title={Europäische Produktion von gedruckten Büchern ca. 1450--1800$^{\text{\tiny{*}}}$},
        title style={font=\large\bfseries, align=center,yshift=1ex}
        ]

\addplot +[fill=RYB1, draw=RYB1!50!black] table [y=Books] {\datatable};
\draw (rel axis cs:0,0) -- (rel axis cs:1,0);
  \end{axis}
\node at (current axis.below south) [anchor=north, align=left, font=\tiny] {$^*$ohne Südosteuropa (osmanischer Bereich) und Russland};

\end{tikzpicture}
\end{document}
Licensing edit
I, the copyright holder of this work, hereby publish it under the following license:
This file is licensed under the Creative Commons Attribution-Share Alike 3.0 Unported license.
- You are free:
- to share – to copy, distribute and transmit the work
- to remix – to adapt the work
- Under the following conditions:
- attribution – You must give appropriate credit, provide a link to the license, and indicate if changes were made. You may do so in any reasonable manner, but not in any way that suggests the licensor endorses you or your use.
- share alike – If you remix, transform, or build upon the material, you must distribute your contributions under the same or compatible license as the original.
File history
Click on a date/time to view the file as it appeared at that time.
| Date/Time | Thumbnail | Dimensions | User | Comment | |
|---|---|---|---|---|---|
| current | 03:14, 22 December 2011 | | 1,404 × 953 (63 KB) | Tentotwo (talk | contribs) |
You cannot overwrite this file.
File usage on Commons
The following 2 pages use this file:
File usage on other wikis
The following other wikis use this file:
- Usage on de.wikipedia.org
- Usage on fy.wikipedia.org
- Usage on nl.wikipedia.org