File:Fst East Asia.svg

Size of this PNG preview of this SVG file: 566 × 599 pixels. Other resolutions: 227 × 240 pixels | 454 × 480 pixels | 726 × 768 pixels | 968 × 1,024 pixels | 1,935 × 2,048 pixels | 1,116 × 1,181 pixels.
Original file (SVG file, nominally 1,116 × 1,181 pixels, file size: 589 KB)
Captions
Captions
Add a one-line explanation of what this file represents
Summary edit
| Description |
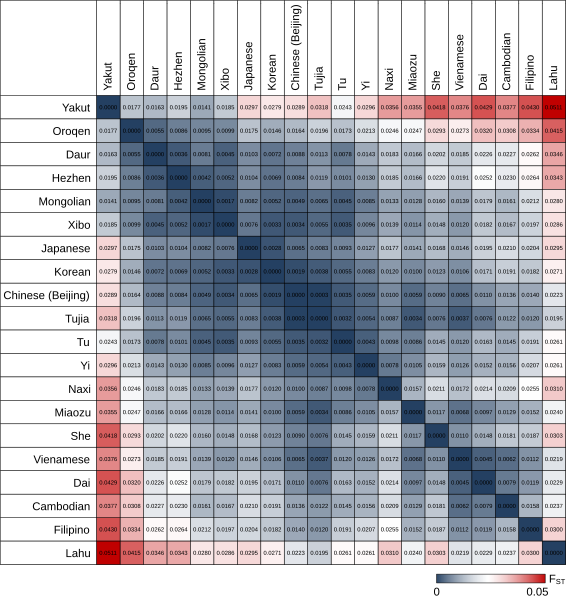
English: Heat map of paired Fst values of East Asian populations. The Fst values were obtained using three random non-overlapping sets of 3500 SNPs distributed over the autosomal genome (minimum of 50 kb distance between SNPs). This approach was taken to limit potential bias from SNPs in close linkage disequilibrium and to measure of variability of Fst. The small differences in these independent samplings (mean SD = 0.0015; median SD = 0.0013) indicate that this approach resulted in good estimations of paired Fst values. Relatively large Fst values were evident between many of the relatively small ethnic groups within China. In particular, those population groups derived from Mongolia or near by provinces including Oroqen, Hezhen, and Daur show relatively large differences with Han Chinese. Similarly, two of the ethnic groups in the southeastern region of China, Lahu and Dai, also showed large paired Fst values with Han Chinese. With respect to population groups derived from very populous groups, the data indicate that Japanese and Korean were very closely related, as were Korean and Han Chinese but that these groups are much further from the south-east Asian populations (Filipino and Vietnamese). The Han Chinese and Japanese groups showed larger separation than either with Korean, although the paired Fst values were still small relative to Chinese/Filipino Fst. The Fst values also showed a close relationship between the Dai ethnic group in China and the Vietnamese population sample. Each of the groups had large paired Fst values with the Yakut from Siberia with the exception of the Mongolian, Hezhen and Oroqen ethnic groups that derive from north-eastern China or Mongolia. The relative size of the Fst values also generally corresponded to the geographical separation of the EAS population groups. |
| Date | Published: December 5, 2008 |
| Source | Tian C, Kosoy R, Lee A, Ransom M, Belmont JW, Gregersen PK, et al. (2008) Analysis of East Asia Genetic Substructure Using Genome-Wide SNP Arrays. PLoS ONE 3(12): e3862. doi:10.1371/journal.pone.0003862 http://journals.plos.org/plosone/article?id=10.1371/journal.pone.0003862 |
| Author | Chao Tian, Roman Kosoy, Annette Lee, Michael Ransom, John W. Belmont, Peter K. Gregersen, Michael F. Seldin |
| Other versions |
 _in_a_diverse_set_of_subjects_of_East_Asian_Descent.png)    |
|
This file is licensed under the Creative Commons Attribution 2.5 Generic license.
|
This file was published in a Public Library of Science journal. Their website states that the content of all PLOS journals is published under the Creative Commons Attribution 4.0 license (or its previous version depending on the publication date), unless indicated otherwise.
|
File history
Click on a date/time to view the file as it appeared at that time.
| Date/Time | Thumbnail | Dimensions | User | Comment | |
|---|---|---|---|---|---|
| current | 06:15, 20 November 2016 | | 1,116 × 1,181 (589 KB) | Was a bee (talk | contribs) | adding color bar & fix color profile |
| 03:29, 20 November 2016 |  | 1,156 × 1,149 (531 KB) | Was a bee (talk | contribs) | == {{int:filedesc}} == {{Information |Description={{en|1=Paired Fst values of East Asian populations. The Fst values were obtained using three random non-overlapping sets of 3500 SNPs distributed over the autosomal genome (minimum of 50 kb distance bet... |
You cannot overwrite this file.
File usage on Commons
There are no pages that use this file.