File:Geometric cdf.svg

Size of this PNG preview of this SVG file: 675 × 288 pixels. Other resolutions: 320 × 137 pixels | 640 × 273 pixels | 1,024 × 437 pixels | 1,280 × 546 pixels | 2,560 × 1,092 pixels.
Original file (SVG file, nominally 675 × 288 pixels, file size: 116 KB)
Captions
Captions
Add a one-line explanation of what this file represents
Summary edit
| Description |
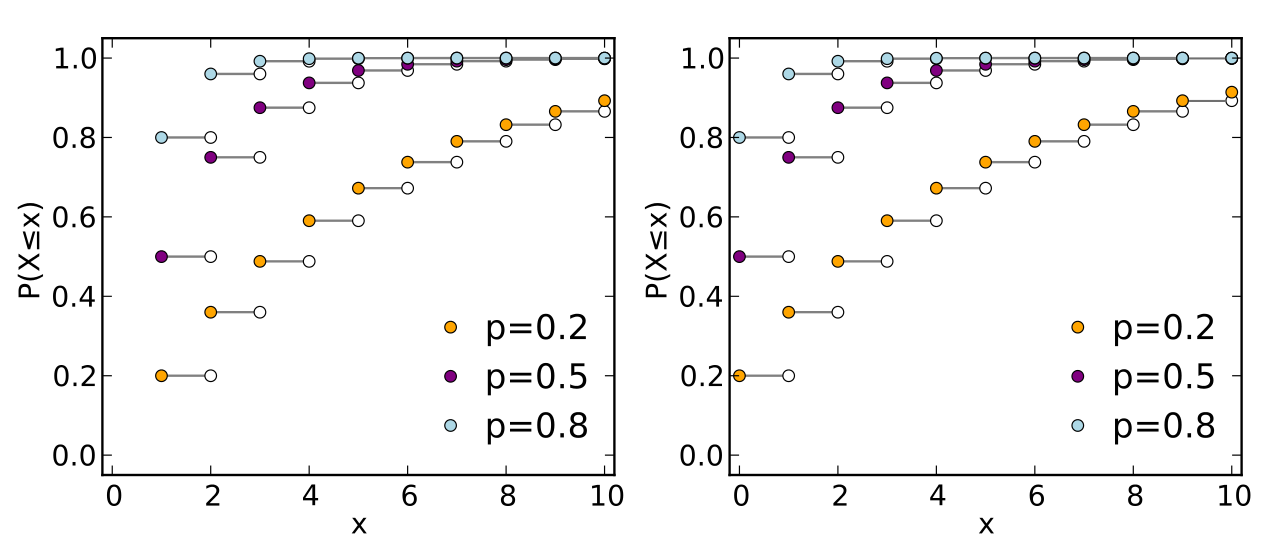
English: Plots of the cumulative distribution functions for several members of the geometric family of probability distributions. |
| Date | |
| Source |
Own work |
| Author | Skbkekas |
| SVG development | This plot was created with Matplotlib. |
| Source code | Python codeimport numpy as np
import matplotlib.pyplot as plt
import scipy.special as sp
col = {0.2: 'orange', 0.5: 'purple', 0.8: 'lightblue'}
plt.clf()
plt.figure(figsize=(7.5,3.2))
ax1 = plt.axes([0.08,0.13,0.4,0.8])
ax2 = plt.axes([0.57,0.13,0.4,0.8])
plt.hold(True)
X1 = np.arange(1,11)
X2 = np.arange(0,11)
ms = 4.9
A1,A2 = [],[]
for p in 0.2,0.5,0.8:
Y1 = 1 - (1-p)**X1
Y2 = 1 - (1-p)**(X2+1)
for k in range(len(Y1)-1):
ax1.plot([X1[k],X1[k]+1], [Y1[k],Y1[k]], '-', color='grey')
ax2.plot([X2[k],X2[k]+1], [Y2[k],Y2[k]], '-', color='grey')
ax1.plot(X1[1:], Y1[:-1], 'o', mec='k', mfc='w', ms=ms)
ax2.plot(X2[1:], Y2[:-1], 'o', mec='k', mfc='w', ms=ms)
a1 = ax1.plot(X1, Y1, 'o', color=col[p], ms=ms)
a2 = ax2.plot(X2, Y2, 'o', color=col[p], ms=ms)
A1.append(a1)
A2.append(a2)
ax1.set_xlabel("x")
ax1.set_ylabel(u"P(X\N{Less-THAN OR EQUAL TO}x)")
ax2.set_xlabel("x")
ax2.set_ylabel(u"P(X\N{Less-THAN OR EQUAL TO}x)")
bx1 = ax1.legend(A1, ("p=0.2", "p=0.5", "p=0.8"),\
numpoints=1, handletextpad=0, loc="lower right")
bx2 = ax2.legend(A2, ("p=0.2", "p=0.5", "p=0.8"),\
numpoints=1, handletextpad=0, loc="lower right")
bx1.draw_frame(False)
bx2.draw_frame(False)
ax1.set_xlim(-0.2,10.2)
ax2.set_xlim(-0.2,10.2)
ax1.set_ylim(-0.05,1.05)
ax2.set_ylim(-0.05,1.05)
plt.savefig("geometric_cdf.pdf")
plt.savefig("geometric_cdf.svg")
|
Licensing edit
I, the copyright holder of this work, hereby publish it under the following license:
This file is licensed under the Creative Commons Attribution 3.0 Unported license.
- You are free:
- to share – to copy, distribute and transmit the work
- to remix – to adapt the work
- Under the following conditions:
- attribution – You must give appropriate credit, provide a link to the license, and indicate if changes were made. You may do so in any reasonable manner, but not in any way that suggests the licensor endorses you or your use.
File history
Click on a date/time to view the file as it appeared at that time.
| Date/Time | Thumbnail | Dimensions | User | Comment | |
|---|---|---|---|---|---|
| current | 21:26, 1 May 2013 | | 675 × 288 (116 KB) | Dicklyon (talk | contribs) | Paint in the missing strokes in upper right part of right plot. |
| 00:34, 1 March 2010 |  | 675 × 288 (76 KB) | Skbkekas (talk | contribs) | Add open circles to make it clear that it is right continuous. | |
| 23:32, 26 February 2010 |  | 675 × 288 (64 KB) | Skbkekas (talk | contribs) | {{Information |Description={{en|1=Plots of the cumulative distribution functions for several members of the geometric family of probability distributions.}} |Source={{own}} |Author=Skbkekas |Date=2010-02-26 |Permission= |other_versions= |
You cannot overwrite this file.
File usage on Commons
There are no pages that use this file.
File usage on other wikis
The following other wikis use this file:
- Usage on be.wikipedia.org
- Usage on ca.wikipedia.org
- Usage on en.wikipedia.org
- Usage on en.wikibooks.org
- Usage on ja.wikipedia.org
- Usage on pl.wikipedia.org
- Usage on tr.wikipedia.org
- Usage on uk.wikipedia.org
- Usage on zh.wikipedia.org