File:Ggplot2 scatter plot.svg

Size of this PNG preview of this SVG file: 703 × 515 pixels. Other resolutions: 320 × 234 pixels | 640 × 469 pixels | 1,024 × 750 pixels | 1,280 × 938 pixels | 2,560 × 1,875 pixels.
Original file (SVG file, nominally 703 × 515 pixels, file size: 58 KB)
Captions
Captions
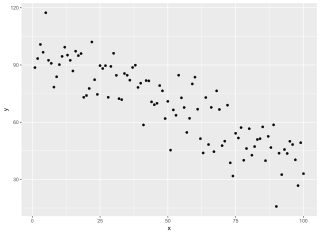
A scatterplot made using ggplot2 in R
Summary edit
| Description |
English: Example scatterplot using default settings for ggplot2. |
| Date | |
| Source | Own work |
| Author | Colohisto |
| Other versions |
|
| SVG development | |
| Source code | R codelibrary(ggplot2)
x<- 1:100;
y<- 100 - 0.6*x - rnorm(100, 0, 10)
qplot(x,y)
|

Licensing edit
I, the copyright holder of this work, hereby publish it under the following license:
This file is licensed under the Creative Commons Attribution 4.0 International license.
- You are free:
- to share – to copy, distribute and transmit the work
- to remix – to adapt the work
- Under the following conditions:
- attribution – You must give appropriate credit, provide a link to the license, and indicate if changes were made. You may do so in any reasonable manner, but not in any way that suggests the licensor endorses you or your use.
File history
Click on a date/time to view the file as it appeared at that time.
| Date/Time | Thumbnail | Dimensions | User | Comment | |
|---|---|---|---|---|---|
| current | 22:56, 4 April 2024 | | 703 × 515 (58 KB) | Colohisto (talk | contribs) | Uploaded own work with UploadWizard |
You cannot overwrite this file.
File usage on Commons
The following page uses this file: