File:Graph - Cardinals and conclaves.png
Size of this preview: 800 × 442 pixels. Other resolutions: 320 × 177 pixels | 856 × 473 pixels.
Original file (856 × 473 pixels, file size: 23 KB, MIME type: image/png)
Captions
Captions
Add a one-line explanation of what this file represents
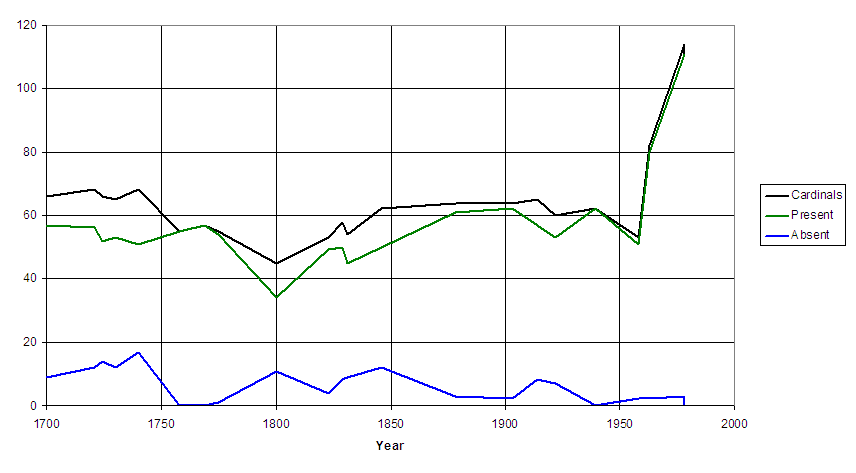
A graph showing the number of cardinals (definitive, present and absent) during papal conclaves since 1700.
Created by me in Microsoft Excel, an X-Y Scatter graph.

|
The copyright holder of this file allows anyone to use it for any purpose, provided that the copyright holder is properly attributed. Redistribution, derivative work, commercial use, and all other use is permitted. |
|
|
File history
Click on a date/time to view the file as it appeared at that time.
| Date/Time | Thumbnail | Dimensions | User | Comment | |
|---|---|---|---|---|---|
| current | 20:24, 10 April 2005 | | 856 × 473 (23 KB) | OldakQuill (talk | contribs) | A graph showing the number of cardinals (definitive, present and absent) during papal conclaves since 1700. Created by me in Microsoft Excel, an X-Y Scatter graph. {{User:OldakQuill/creations}} |
You cannot overwrite this file.
File usage on Commons
The following page uses this file:
File usage on other wikis
The following other wikis use this file:
- Usage on cs.wikipedia.org
- Usage on da.wikipedia.org
- Usage on fr.wikipedia.org
- Usage on no.wikipedia.org
- Usage on sv.wikipedia.org