File:Graph of function of 2 variables.png
No higher resolution available.
Graph_of_function_of_2_variables.png (551 × 447 pixels, file size: 109 KB, MIME type: image/png)
Captions
Captions
Add a one-line explanation of what this file represents
Summary edit
| Description |
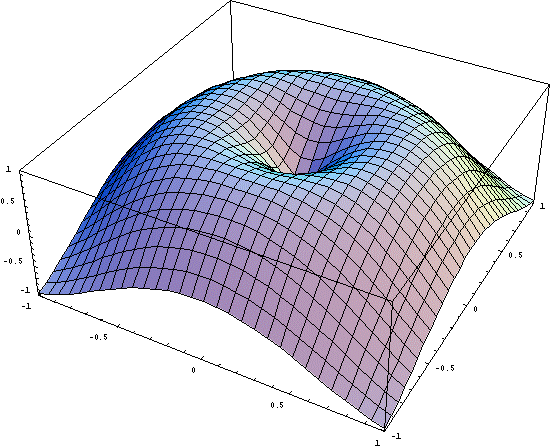
English: graph of function of 2 variables
中文(中国大陆):二元函数图像
|
| Date | |
| Source |
Own work This diagram was created with Mathematica. |
| Author | Zasdfgbnm |

Licensing edit
| I, the copyright holder of this work, release this work into the public domain. This applies worldwide. In some countries this may not be legally possible; if so: I grant anyone the right to use this work for any purpose, without any conditions, unless such conditions are required by law. |
File history
Click on a date/time to view the file as it appeared at that time.
| Date/Time | Thumbnail | Dimensions | User | Comment | |
|---|---|---|---|---|---|
| current | 12:18, 31 December 2008 | | 551 × 447 (109 KB) | Zasdfgbnm (talk | contribs) | {{Information |Description={{en|1=graph of function of 2 variables <math>z=\sin (\pi\times\sqrt{x^2+y^2})</math>}} {{zh-cn|1=二元函数图像 <math>z=\sin (\pi\times\sqrt{x^2+y^2})</math>}} |Source=Own work |Author=Zasdfgbnm |Date=200 |
You cannot overwrite this file.
File usage on Commons
The following page uses this file:
File usage on other wikis
The following other wikis use this file:
- Usage on ar.wikipedia.org
- Usage on ast.wikipedia.org
- Usage on bg.wikipedia.org
- Usage on da.wikipedia.org
- Usage on el.wikipedia.org
- Usage on fi.wiktionary.org
- Usage on fr.wikipedia.org
- Usage on ia.wikipedia.org
- Usage on it.wikipedia.org
- Usage on kl.wikipedia.org
- Usage on pl.wikipedia.org
- Usage on tl.wikipedia.org
- Usage on uk.wikipedia.org
- Usage on uk.wikiquote.org
- Usage on www.wikidata.org