File:Imperfect competition after regulation.svg

Size of this PNG preview of this SVG file: 580 × 400 pixels. Other resolutions: 320 × 221 pixels | 640 × 441 pixels | 1,024 × 706 pixels | 1,280 × 883 pixels | 2,560 × 1,766 pixels.
Original file (SVG file, nominally 580 × 400 pixels, file size: 4 KB)
Captions
Captions
Add a one-line explanation of what this file represents
| Description |
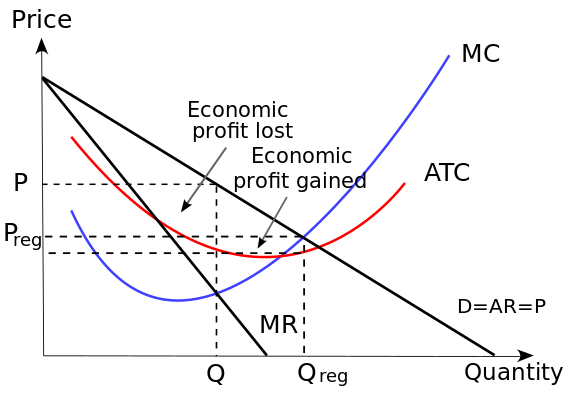
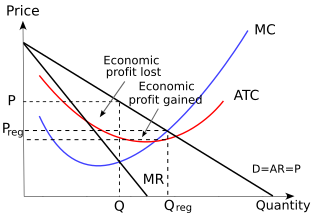
English: Diagram showing a firm in imperfect competition (e.g. a monopoly) - when price regulation forced it to decrease its price from P to Preg. The profit maximising firm therefore chooses to expand output from Q to Qreg. Its economic profit is reduced, but not removed entirely; for the government's point of view, allocative efficiency is achieved.
The diagram has been slightly simplified. Technically, the regulation would cause the MR curve to be malformed, but to no particular consequence other than the common sense one of reduced prices. The costs at Q and Qreg are shown as equal merely out of convenience. |
| Date | (UTC) |
| Source | |
| Author |
|
This file is licensed under the Creative Commons Attribution-Share Alike 3.0 Unported license.
- You are free:
- to share – to copy, distribute and transmit the work
- to remix – to adapt the work
- Under the following conditions:
- attribution – You must give appropriate credit, provide a link to the license, and indicate if changes were made. You may do so in any reasonable manner, but not in any way that suggests the licensor endorses you or your use.
- share alike – If you remix, transform, or build upon the material, you must distribute your contributions under the same or compatible license as the original.
Original upload log edit
This image is a derivative work of the following images:
- File:MonopolyPower-GovRegulated.jpg licensed with PD-self
- 2010-04-11T16:42:21Z Mgmwki 643x557 (61384 Bytes) {{Information |Description="Government Price Control Impact on Monopoly Market" |Source={{own}} |Date=~~~~ |Author= [[User:Mgmwki|Mgmwki]] |Permission=General Microeconomic Theory Established for 100 years |other_versions=Mon
- File:Perfect_competition_in_the_short_run.svg licensed with Cc-by-sa-3.0
- 2010-10-15T16:18:39Z Jarry1250 580x400 (2908 Bytes) == int:filedesc == == int:filedesc == Better economics
- 2010-10-05T20:59:03Z Jarry1250 560x400 (3824 Bytes) == Summary == Economics error fixed.
- 2010-10-05T20:52:52Z Jarry1250 560x400 (3823 Bytes) == Summary == Try to realign again.
- 2010-10-05T20:51:10Z Jarry1250 560x400 (3823 Bytes) == Summary == == Summary == Minor fixes
- 2010-10-05T20:45:52Z Jarry1250 560x400 (3803 Bytes) {{Information |Description={{en|Diagram showing that it is possible that a firm in [[:en:perfect competition|]] makes an [[:en:Economic profit|abnormal profit]], if P > min(ATC). In the [[:en:long run|]], however, only normal
Uploaded with derivativeFX
File history
Click on a date/time to view the file as it appeared at that time.
| Date/Time | Thumbnail | Dimensions | User | Comment | |
|---|---|---|---|---|---|
| current | 21:00, 19 December 2010 | | 580 × 400 (4 KB) | Jarry1250 (talk | contribs) | {{Information |Description={{en|Diagram showing a firm in imperfect competition (e.g. a en:monopoly) - when price regulation forced it to decrease its price from P to P<sub>reg</sub>. The profit maximising firm therefore |
You cannot overwrite this file.
File usage on Commons
There are no pages that use this file.
File usage on other wikis
The following other wikis use this file:
- Usage on en.wikipedia.org
- Usage on hi.wikipedia.org
- Usage on pt.wikipedia.org
- Usage on tl.wikipedia.org