File:J curve.svg

Size of this PNG preview of this SVG file: 316 × 200 pixels. Other resolutions: 320 × 203 pixels | 640 × 405 pixels | 1,024 × 648 pixels | 1,280 × 810 pixels | 2,560 × 1,620 pixels.
Original file (SVG file, nominally 316 × 200 pixels, file size: 9 KB)
Captions
Captions
Add a one-line explanation of what this file represents
Summary edit
| Description |
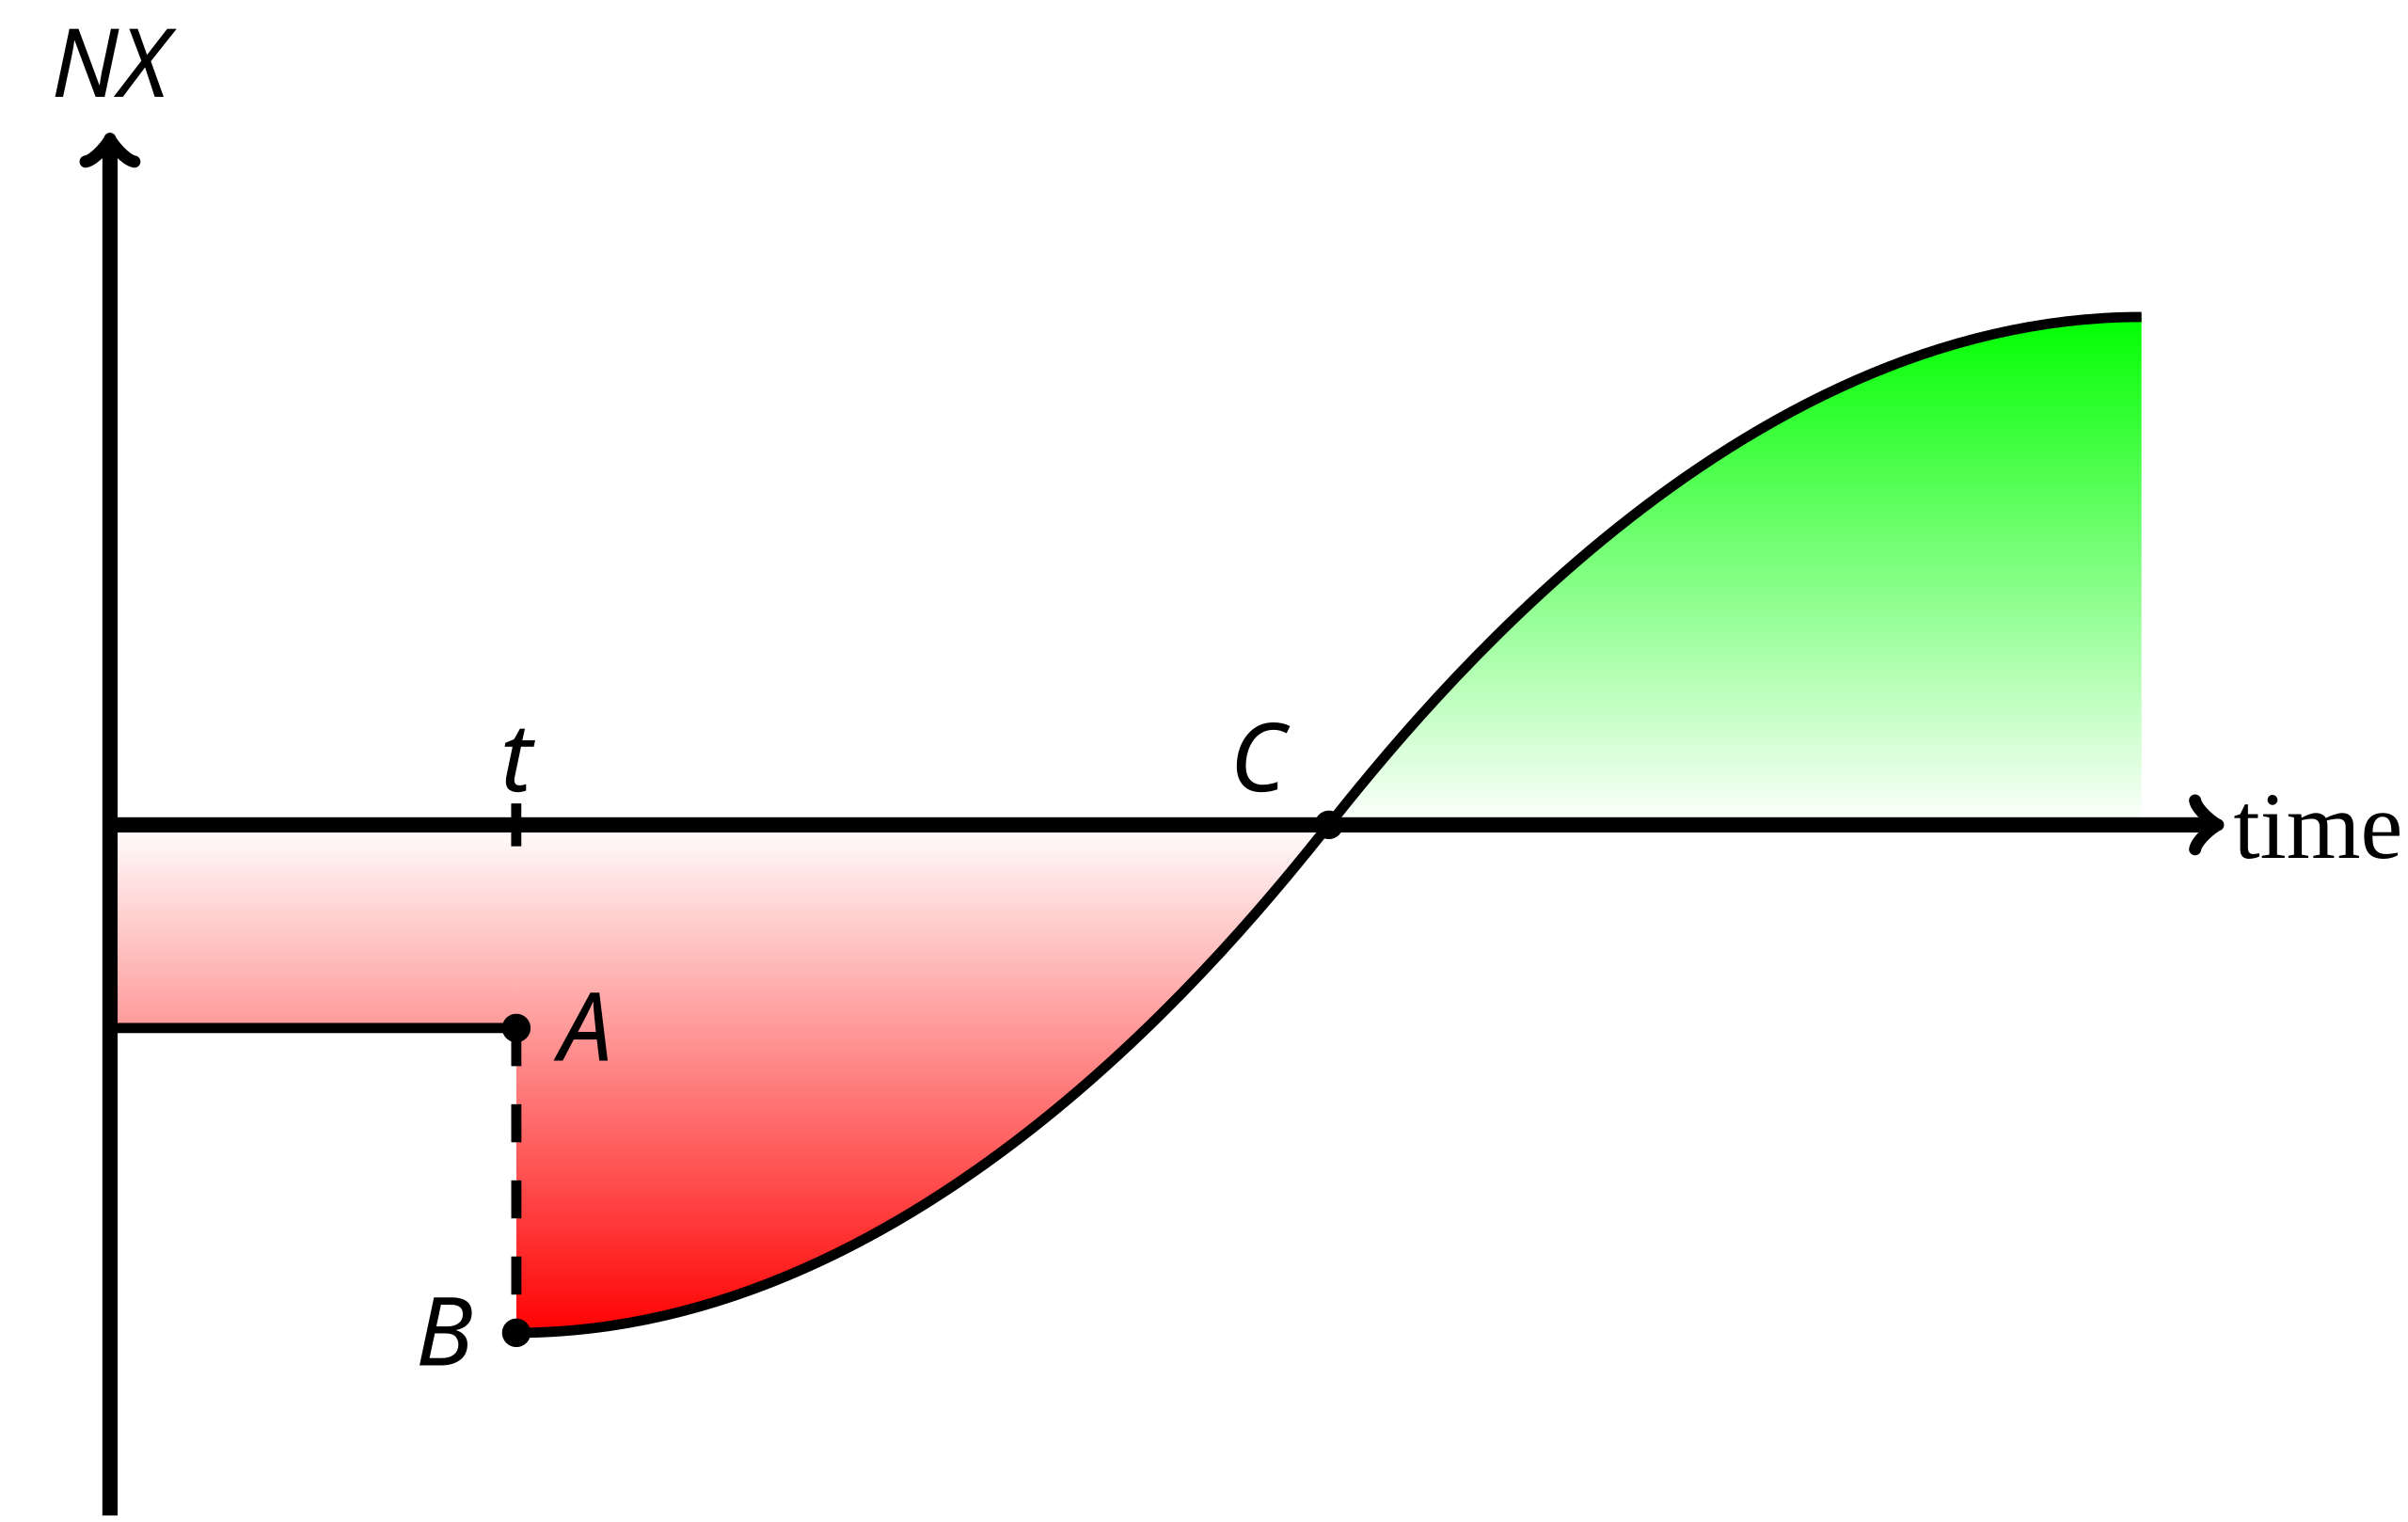
English: The J curve shows the effect of a devaluation of a currency on the net export (exports minus imports). When the devaluation takes place at t the net export falls from A to B, since the level of import is unchanged, but the currency is worth less. As time goes on the net export will gradually change since consumers buy less imported goods, and other countries buy more goods from the country due to the lower real price. At C the net export break even. With time the net export will find equilibrium. |
| Date | |
| Source | I created this image entirely by myself. |
| Author | Rasmus (talk) |
| Other versions | The image is made with PGF. The original Tikz code can be found here: [1] |
Licensing edit
Rasmus.p at English Wikipedia, the copyright holder of this work, hereby publishes it under the following licenses:
This file is licensed under the Creative Commons Attribution-Share Alike 3.0 Unported license.
Attribution: Rasmus.p at English Wikipedia
- You are free:
- to share – to copy, distribute and transmit the work
- to remix – to adapt the work
- Under the following conditions:
- attribution – You must give appropriate credit, provide a link to the license, and indicate if changes were made. You may do so in any reasonable manner, but not in any way that suggests the licensor endorses you or your use.
- share alike – If you remix, transform, or build upon the material, you must distribute your contributions under the same or compatible license as the original.

|
Permission is granted to copy, distribute and/or modify this document under the terms of the GNU Free Documentation License, Version 1.2 or any later version published by the Free Software Foundation; with no Invariant Sections, no Front-Cover Texts, and no Back-Cover Texts. A copy of the license is included in the section entitled GNU Free Documentation License. |
You may select the license of your choice.
Original upload log edit
The original description page was here. All following user names refer to en.wikipedia.
| Date/Time | Dimensions | User | Comment |
|---|---|---|---|
| 2008-06-06 09:58 | 316×200× (9344 bytes) | Rasmus.p | {{Information |Description=The J curve shows the effect of a devaluation of a currency on the net export (exports minus imports). When the devaluation takes place at ''t'' the net export falls from ''A'' to be, since the level of import is unchanged, but |
File history
Click on a date/time to view the file as it appeared at that time.
| Date/Time | Thumbnail | Dimensions | User | Comment | |
|---|---|---|---|---|---|
| current | 08:19, 2 February 2016 | | 316 × 200 (9 KB) | Kopiersperre (talk | contribs) | Transferred from en.wikipedia |
You cannot overwrite this file.
File usage on Commons
There are no pages that use this file.
File usage on other wikis
The following other wikis use this file:
- Usage on ca.wikipedia.org
- Usage on es.wikipedia.org