File:Landkreis Lichtenfels Bevoelkerungsentwicklung.svg

Size of this PNG preview of this SVG file: 800 × 400 pixels. Other resolutions: 320 × 160 pixels | 640 × 320 pixels | 1,024 × 512 pixels | 1,280 × 640 pixels | 2,560 × 1,280 pixels.
Original file (SVG file, nominally 800 × 400 pixels, file size: 27 KB)
Captions
Captions
Add a one-line explanation of what this file represents
Summary edit
| Description |
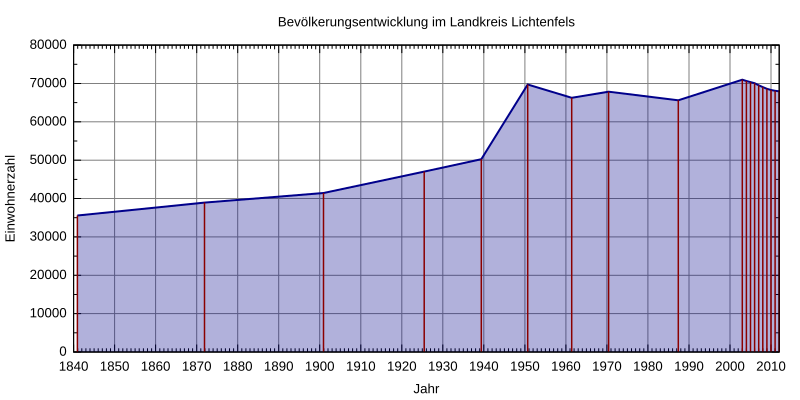
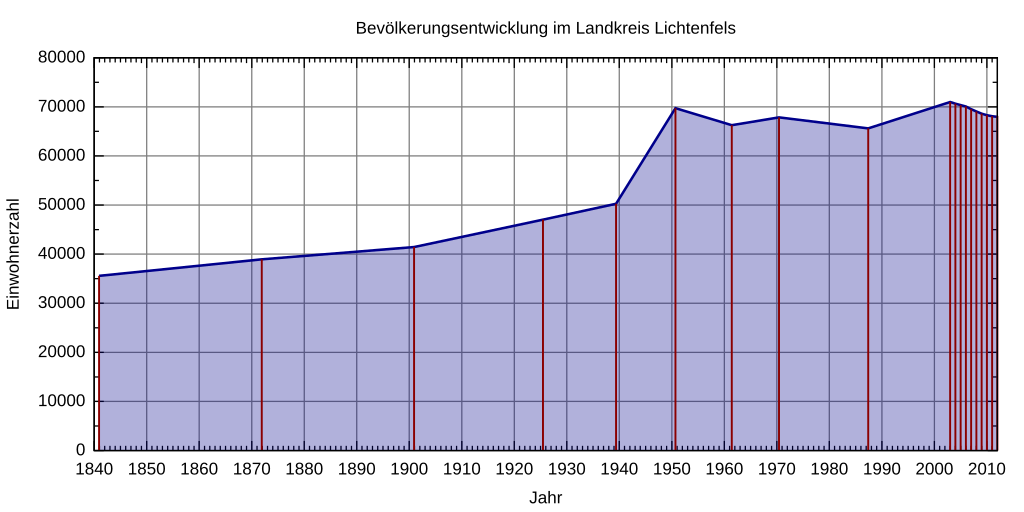
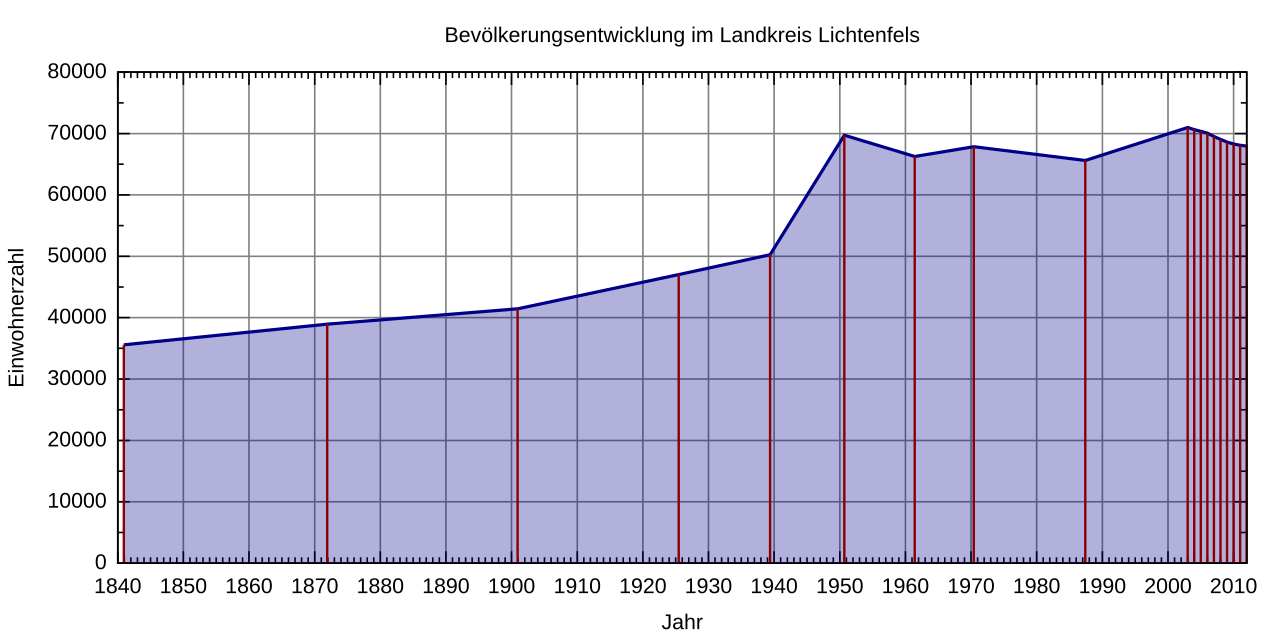
Deutsch: Bevölkerungsentwicklung des Landkreises Lichtenfels. Graphik nach "Bayerisches Landesamt fuer Statistik: Statistik kommunal 2012 ‒ Eine Auswahl wichtiger statistischer Daten fuer den Landkreis Lichtenfels.". |
| Date | |
| Source | Own work |
| Author | Michael Fiedler |
Licensing edit
I, the copyright holder of this work, hereby publish it under the following license:
This file is licensed under the Creative Commons Attribution-Share Alike 3.0 Unported license.
- You are free:
- to share – to copy, distribute and transmit the work
- to remix – to adapt the work
- Under the following conditions:
- attribution – You must give appropriate credit, provide a link to the license, and indicate if changes were made. You may do so in any reasonable manner, but not in any way that suggests the licensor endorses you or your use.
- share alike – If you remix, transform, or build upon the material, you must distribute your contributions under the same or compatible license as the original.
Gnuplot script to generate this plot edit
#!/usr/bin/gnuplot
# gnuplot 4.6 / Debian 7
#
# Graphik nach "Bayerisches Landesamt fuer Statistik: Statistik kommunal 2012 -
# Eine Auswahl wichtiger statistischer Daten fuer den Landkreis Lichtenfels.",
# https://www.statistik.bayern.de/statistikkommunal/09478.pdf
#
# Erstellt von Michael Fiedler <michael.fiedler87@gmx.de>
# Lizenz: CC-BY-SA 3.0 unported, https://creativecommons.org/licenses/by-sa/3.0/deed.de
# Basierend auf http://commons.wikimedia.org/wiki/File:Muc_population.svg von Gorgo

# input
set timefmt "%d.%m.%Y"

# output
set title 'Bevölkerungsentwicklung im Landkreis Lichtenfels'
unset key
set style fill transparent solid 0.3
set grid

set xdata time
set xlabel 'Jahr'
set xrange ['01.01.1840':'31.12.2011']
# Jahreszahl alle 10 Jahre (Erhoehung in 0.1 Sekunden)
# Der Zahlenwert entspricht einem Jahr mit 365,25 Tagen
set xtics 315576000
# Zehnjahresintervall in 9 Intervalle unterteilt (jedes Jahr eine Markierung)
set mxtics 10
set format x '%Y'

set ylabel 'Einwohnerzahl'
# Beschriftungsintervall
# weitere Unterteilung ohne Beschriftung
set mytics 2
set yrange ['0':]


set terminal svg size 800,400 font 'Arial,10'
set output 'Landkreis_Lichtenfels_Bevoelkerungsentwicklung.svg'

# '-' nimmt die nachfolgenden Daten als Eingabewerte
plot '-' using 1:($2) with filledcurves below x1 linetype rgb 'dark-blue' linewidth 2, \
	    '-' using 1:($2) with impulses linecolor rgbcolor 'dark-red' linewidth 1.5
	01.12.1840 35577
	01.12.1871 38955
	01.12.1900 41456
	16.06.1925 47013
	17.05.1939 50246
	13.09.1950 69722
	06.06.1961 66269
	27.05.1970 67863
	25.05.1987 65602
	31.12.2002 70984
	31.12.2003 70640
	31.12.2004 70350
	31.12.2005 70057
	31.12.2006 69519
	31.12.2007 69045
	31.12.2008 68617
	31.12.2009 68286
	31.12.2010 68087
	31.12.2011 67952
EOF
File history
Click on a date/time to view the file as it appeared at that time.
| Date/Time | Thumbnail | Dimensions | User | Comment | |
|---|---|---|---|---|---|
| current | 17:56, 21 April 2014 | | 800 × 400 (27 KB) | Simified (talk | contribs) | xrange korrigiert |
| 09:44, 23 March 2014 |  | 800 × 400 (27 KB) | Simified (talk | contribs) | fix mxtics | |
| 05:25, 23 March 2014 |  | 800 × 400 (27 KB) | Simified (talk | contribs) | User created page with UploadWizard |
You cannot overwrite this file.
File usage on Commons
There are no pages that use this file.
File usage on other wikis
The following other wikis use this file:
- Usage on de.wikipedia.org