File:Logistic-t-normal-extreme-tails.svg

Size of this PNG preview of this SVG file: 600 × 600 pixels. Other resolutions: 240 × 240 pixels | 480 × 480 pixels | 768 × 768 pixels | 1,024 × 1,024 pixels | 2,048 × 2,048 pixels | 630 × 630 pixels.
Original file (SVG file, nominally 630 × 630 pixels, file size: 442 KB)
Captions
Captions
Add a one-line explanation of what this file represents
Summary edit
| Description |
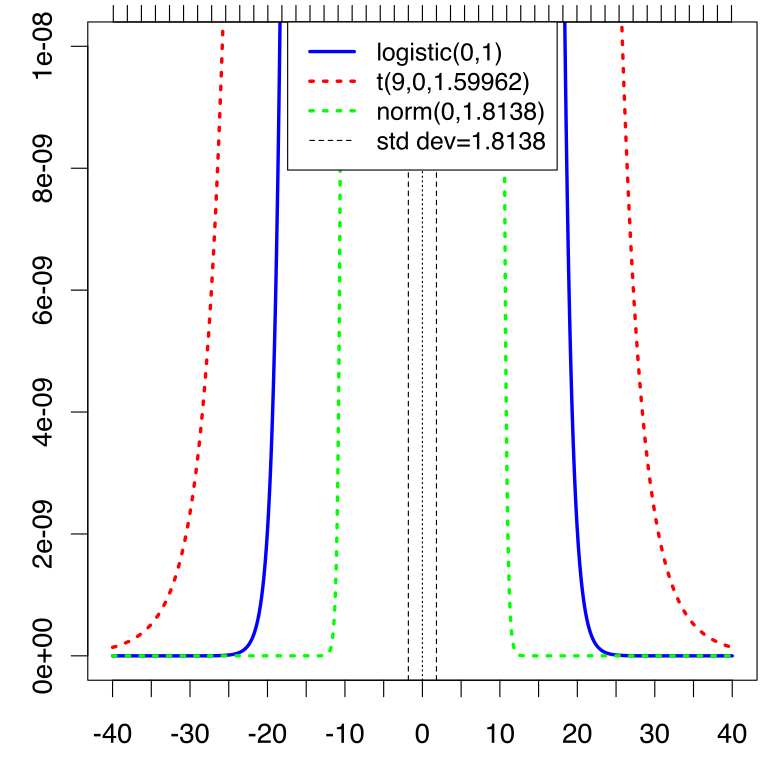
English: Comparison of standard logistic distribution with closest normal and Student's t distributions, by matching moments -- extreme tail portion.
Created using the following R code:
|
||
| Date | |||
| Source | Created using R | ||
| Author | Benwing |
Licensing edit
I, the copyright holder of this work, hereby publish it under the following licenses:

|
Permission is granted to copy, distribute and/or modify this document under the terms of the GNU Free Documentation License, Version 1.2 or any later version published by the Free Software Foundation; with no Invariant Sections, no Front-Cover Texts, and no Back-Cover Texts. A copy of the license is included in the section entitled GNU Free Documentation License. |
This file is licensed under the Creative Commons Attribution-Share Alike 4.0 International, 3.0 Unported, 2.5 Generic, 2.0 Generic and 1.0 Generic license.
- You are free:
- to share – to copy, distribute and transmit the work
- to remix – to adapt the work
- Under the following conditions:
- attribution – You must give appropriate credit, provide a link to the license, and indicate if changes were made. You may do so in any reasonable manner, but not in any way that suggests the licensor endorses you or your use.
- share alike – If you remix, transform, or build upon the material, you must distribute your contributions under the same or compatible license as the original.
You may select the license of your choice.
File history
Click on a date/time to view the file as it appeared at that time.
| Date/Time | Thumbnail | Dimensions | User | Comment | |
|---|---|---|---|---|---|
| current | 04:53, 28 March 2012 | | 630 × 630 (442 KB) | Benwing (talk | contribs) | add std dev tick marks along top |
| 03:28, 28 March 2012 |  | 630 × 630 (432 KB) | Benwing (talk | contribs) | {{Information |description = {{en|1=Comparison of standard logistic distribution with closest normal and Student's t distributions, by matching moments -- extreme tail portion. Created using the following R code: {{cot|Source Code}} <source lang="rsplu... |
You cannot overwrite this file.
File usage on Commons
There are no pages that use this file.
File usage on other wikis
The following other wikis use this file:
- Usage on zh.wikipedia.org