File:Map of GDP per capita in the UK in 2007 (NUTS 3).svg

Size of this PNG preview of this SVG file: 146 × 205 pixels. Other resolutions: 171 × 240 pixels | 342 × 480 pixels | 547 × 768 pixels | 729 × 1,024 pixels | 1,458 × 2,048 pixels.
Original file (SVG file, nominally 146 × 205 pixels, file size: 652 KB)
Captions
Captions
Add a one-line explanation of what this file represents
| Description |
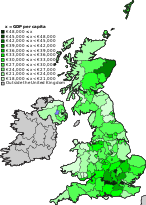
English: A map of the United Kingdom (including Ireland and part of France) divided by NUTS level 3 areas. NUTS 3 areas loosely follow the administrative geography of the UK. The NUTS 3 areas are shaded green according to their GDP per capita in 2007 at current market prices in euros; darker green denotes higher GDP per capita and lighter green, lower GDP per capita. |
| Date |
|
| Source |
|
| Author |
|
| Permission (Reusing this file) |
This file is licensed under the Creative Commons Attribution-Share Alike 2.5 Generic license.
|
| Other versions |
.png) |
File history
Click on a date/time to view the file as it appeared at that time.
| Date/Time | Thumbnail | Dimensions | User | Comment | |
|---|---|---|---|---|---|
| current | 01:53, 1 August 2010 | | 146 × 205 (652 KB) | Jolly Janner (talk | contribs) | Reverted to version as of 14:40, 26 July 2010 |
| 16:41, 28 July 2010 |  | 146 × 205 (660 KB) | Jolly Janner (talk | contribs) | Labelled | |
| 14:40, 26 July 2010 |  | 146 × 205 (652 KB) | Jolly Janner (talk | contribs) | Rounded font size up to whole number | |
| 14:23, 26 July 2010 |  | 146 × 205 (652 KB) | Jolly Janner (talk | contribs) | {{Information |Description={{en|1=A map of the United Kingdom (including Ireland and and France) divided by NUTS level 3 areas. NUTS 3 areas loosely follow the [[:File:Map of the administrative geog |
You cannot overwrite this file.
File usage on Commons
The following 2 pages use this file:
.svg)
File usage on other wikis
The following other wikis use this file:
- Usage on cy.wikipedia.org
- Usage on en.wikipedia.org
- Usage on es.wikipedia.org
- Usage on id.wikipedia.org
- Usage on uk.wikipedia.org
.svg&oldid=462467482)