File:Mauna Loa CO2 monthly mean concentration DE.svg

Size of this PNG preview of this SVG file: 600 × 600 pixels. Other resolutions: 240 × 240 pixels | 480 × 480 pixels | 768 × 768 pixels | 1,024 × 1,024 pixels | 2,048 × 2,048 pixels | 708 × 708 pixels.
Original file (SVG file, nominally 708 × 708 pixels, file size: 438 KB)
Captions
Captions
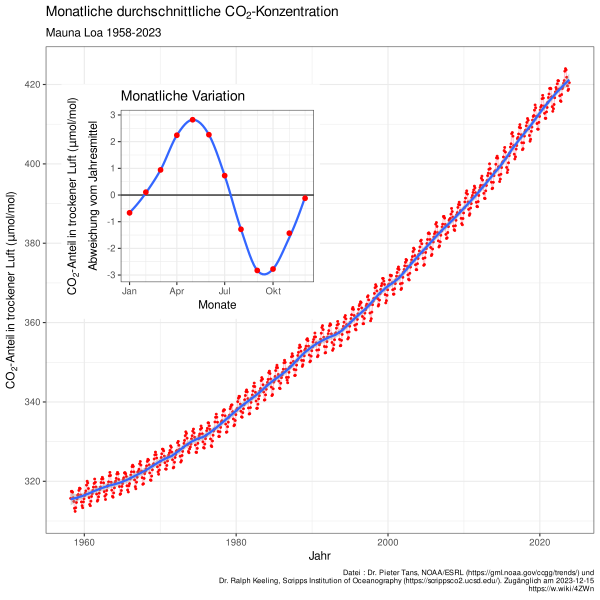
Atmospheric carbon dioxide concentrations at Mauna Loa, Hawaii since 1958 (plot in German)
Summary edit
| Description |
Deutsch: Die Keeling-Kurve ist die graphische Darstellung des mittleren globalen Konzentrationsverlaufs des Spurengases Kohlenstoffdioxid (CO2) in der Erdatmosphäre seit dem Jahr 1958. |
| Date | |
| Source | Own work. Data from Dr. Pieter Tans, NOAA/ESRL and Dr. Ralph Keeling, Scripps Institution of Oceanography. |
| Author | Oeneis |
| Other versions |
[]
Keeling curve edit
|


| Camera location | | View this and other nearby images on: OpenStreetMap |
|---|
Licensing edit
I, the copyright holder of this work, hereby publish it under the following license:
This file is licensed under the Creative Commons Attribution-Share Alike 4.0 International license.
- You are free:
- to share – to copy, distribute and transmit the work
- to remix – to adapt the work
- Under the following conditions:
- attribution – You must give appropriate credit, provide a link to the license, and indicate if changes were made. You may do so in any reasonable manner, but not in any way that suggests the licensor endorses you or your use.
- share alike – If you remix, transform, or build upon the material, you must distribute your contributions under the same or compatible license as the original.
Data source license edit
These data are made freely available to the public and the scientific community in the belief that their wide dissemination will lead to greater understanding and new scientific insights.
— Pieter Tans, in: NOAA
Create this graph edit
R code
# Mauna Loa atmospheric CO2 change
# multi language plot for Wikipedia
# using different possible sources (Scripps if NOAA is not available)
#
# Used for https://commons.wikimedia.org/wiki/File:Mauna_Loa_CO2_monthly_mean_concentration.svg
# and related files in other languages. See all files in :
# https://commons.wikimedia.org/wiki/Template:Other_versions/Mauna_Loa_CO2_monthly_mean_concentration
#
# Update this script on :
# https://commons.wikimedia.org/w/index.php?title=Template:Other_versions/Mauna_Loa_CO2_monthly_mean_concentration.R&action=edit

# Required packages.   used for :
library(readr)         # reading data
library(dplyr)         # data processing
library(ggplot2)       # plot
library(gridExtra)     # plot positionning
library(scales)        # pretty breaks on plot axis
library(lubridate)     # date processing
library(httr)          # check url
library(Hmisc)         # ci from bootstrap

# install all locales beforehand, e.g. :
# sudo locale-gen ca_ES.UTF-8

old_locale <- Sys.getlocale("LC_TIME")

# Translations ------------------------------------------------------------

language <- list(

  ca_ES = list(
    locale_lc_time = "ca_ES.UTF-8",
    title = bquote("Mitjana mensual de la concentratió de"~CO[2]),
    subtitle = "Mauna Loa",
    caption_scripps = paste("dades : R. F. Keeling, S. J. Walker, S. C. Piper and A. F. Bollenbacher\nScripps CO2 Program (https://scrippsco2.ucsd.edu/). Visitada", Sys.Date()),
    caption_noaa = paste("dades : Dr. Pieter Tans, NOAA/ESRL (https://gml.noaa.gov/ccgg/trends/) i\n Dr. Ralph Keeling, Scripps Institution of Oceanography (https://scrippsco2.ucsd.edu/). Visitada ", Sys.Date()),
    x = "any",
    y = bquote("fracció de"~CO[2]~"en aire sec ("*mu*"mol/mol)"),
    x2 = "mes",
    y2 = bquote(atop("fracció de"~CO[2]~"en aire sec ("*mu*"mol/mol)",
                     "desviació de la mitjana anual")),
    title2 = "Variació mensual"
  ),

  cs_CZ = list(
    locale_lc_time = "cs_CZ.UTF-8",
    title = "Průměrné měsíční koncentrace oxidu uhličitého",
    subtitle = "Mauna Loa",
    caption_scripps = paste("data : R. F. Keeling, S. J. Walker, S. C. Piper a A. F. Bollenbacher\nScripps CO2 Program (https://scrippsco2.ucsd.edu/). Přístupné", Sys.Date()),
    caption_noaa = paste("data : Dr. Pieter Tans, NOAA/ESRL (https://gml.noaa.gov/ccgg/trends/) a\nDr. Ralph Keeling, Scripps Institution of Oceanography (https://scrippsco2.ucsd.edu/). Přístupné", Sys.Date()),
    x = "rok",
    y = bquote("koncentrace"~CO[2]~"v suchém vzduchu ("*mu*"mol/mol)"),
    x2 = "měsíc",
    y2 = bquote(atop("koncentrace"~CO[2]~"v suchém vzduchu ("*mu*"mol/mol)", "odchylka od ročního průměru")),
    title2 = "Měsíční změna (průměrná roční odchylka)"
  ),

  de_DE = list(
    locale_lc_time = "de_DE.UTF-8",
    title = bquote("Monatliche durchschnittliche"~CO[2]*"-Konzentration"),
    subtitle = "Mauna Loa",
    caption_scripps = paste("Datei : R. F. Keeling, S. J. Walker, S. C. Piper und A. F. Bollenbacher\nScripps CO2 Program (https://scrippsco2.ucsd.edu/). Zugänglich am", Sys.Date()),
    caption_noaa = paste("Datei : Dr. Pieter Tans, NOAA/ESRL (https://gml.noaa.gov/ccgg/trends/) und\nDr. Ralph Keeling, Scripps Institution of Oceanography (https://scrippsco2.ucsd.edu/). Zugänglich am", Sys.Date()),
    x = "Jahr",
    y = bquote(CO[2]*"-Anteil in trockener Luft ("*mu*"mol/mol)"),
    x2 = "Monate",
    y2 = bquote(atop(CO[2]*"-Anteil in trockener Luft ("*mu*"mol/mol)", "Abweichung vom Jahresmittel")),
    title2 = "Monatliche Variation"
  ),

  en_US = list(
    locale_lc_time = "en_US.UTF-8",
    title = bquote("Monthly mean"~CO[2]~"concentration"),
    subtitle = "Mauna Loa",
    caption_scripps = paste("Data : R. F. Keeling, S. J. Walker, S. C. Piper and A. F. Bollenbacher\nScripps CO2 Program (https://scrippsco2.ucsd.edu/). Accessed", Sys.Date()),
    caption_noaa = paste("Data : Dr. Pieter Tans, NOAA/ESRL (https://gml.noaa.gov/ccgg/trends/) and\n Dr. Ralph Keeling, Scripps Institution of Oceanography (https://scrippsco2.ucsd.edu/). Accessed ", Sys.Date()),
    x = "Year",
    y = bquote(CO[2]~"fraction in dry air ("*mu*"mol/mol)"),
    x2 = "Month",
    y2 = bquote(atop(CO[2]~"fraction in dry air ("*mu*"mol/mol)", "Departure from yearly average")),
    title2 = "Seasonal variation"
  ),

  es_ES = list(
    locale_lc_time = "es_ES.UTF-8",
    title = bquote("Media mensual de la concentración de"~CO[2]),
    subtitle = "Mauna Loa",
    caption_scripps = paste("dato : R. F. Keeling, S. J. Walker, S. C. Piper y A. F. Bollenbacher\nScripps CO2 Program (https://scrippsco2.ucsd.edu/). Visitada", Sys.Date()),
    caption_noaa = paste("dato : Dr. Pieter Tans, NOAA/ESRL (https://gml.noaa.gov/ccgg/trends/) y\nDr. Ralph Keeling, Scripps Institution of Oceanography (https://scrippsco2.ucsd.edu/). Visitada", Sys.Date()),
    x = "Año",
    y = bquote("Fraccion de"~CO[2]~"en aire secco ("*mu*"mol/mol)"),
    x2 = "Mes",
    y2 = bquote(atop("Fraccion de"~CO[2]~"en aire secco ("*mu*"mol/mol)", "Desviación de la media anual")),
    title2 = "Variación mensual"
  ),

  fr_FR = list(
    locale_lc_time = "fr_FR.UTF-8",
    title = bquote("Moyenne mensuelle de la concentration de"~CO[2]),
    subtitle = "Mauna Loa",
    caption_scripps = paste("données : R. F. Keeling, S. J. Walker, S. C. Piper et A. F. Bollenbacher\nScripps CO2 Program (https://scrippsco2.ucsd.edu/). Accédé le", Sys.Date()),
    caption_noaa = paste("données : Dr Pieter Tans, NOAA/ESRL (https://gml.noaa.gov/ccgg/trends/) et\n Dr. Ralph Keeling, Scripps Institution of Oceanography (https://scrippsco2.ucsd.edu/). Accédé le", Sys.Date()),
    x = "année",
    y = bquote("fraction de"~CO[2]~"dans l'air sec ("*mu*"mol/mol)"),
    x2 = "mois",
    y2 = bquote(atop("fraction de"~CO[2]~"dans l'air sec ("*mu*"mol/mol)", "en écart à la moyenne annuelle")),
    title2 = "Variation saisonnière"
  ),

    nl_NL = list(
    locale_lc_time = "nl_NL.UTF-8",
    title = bquote("Maandelijkse gemiddelde"~CO[2]*"-concentratie"),
    subtitle = "Mauna Loa",
    caption_scripps = glue("Gegevens : R. F. Keeling, S. J. Walker, S. C. Piper en A. F. Bollenbacher\nScripps CO2 Program (https://scrippsco2.ucsd.edu/). Geopend {Sys.Date()}"),
    caption_noaa = glue("Gegevens : Dr. Pieter Tans, NOAA/ESRL (https://gml.noaa.gov/ccgg/trends/) en\n Dr. Ralph Keeling, Scripps Institution of Oceanography (https://scrippsco2.ucsd.edu/). Accessed  {Sys.Date()}"),
    x = "Jaar",
    y = bquote(CO[2]*"-fractie in droge lucht ("*mu*"mol/mol)"),
    x2 = "Mannd",
    y2 = bquote(atop(CO[2]*"-fractie in droge lucht ("*mu*"mol/mol)", "Afwijking van jaargemiddelde")),
    title2 = "Seizoensgebonden variatie"
  ),

  nn_NO = list(
    locale_lc_time = "nn_NO.UTF-8",
    title = bquote("Gjennomsnittlig månedlig"~CO[2]*"-konsentrasjon"),
    subtitle = "Mauna Loa",
    caption_scripps = paste("data : R. F. Keeling, S. J. Walker, S. C. Piper og A. F. Bollenbacher\nScripps CO2 Program (https://scrippsco2.ucsd.edu/). Vist", Sys.Date()),
    caption_noaa = paste("data : Dr. Pieter Tans, NOAA/ESRL (https://gml.noaa.gov/ccgg/trends/) og\nDr. Ralph Keeling, Scripps Institution of Oceanography (https://scrippsco2.ucsd.edu/). Vist", Sys.Date()),
    x = "År",
    y = bquote(CO[2]*"-andel i tørr luft ("*mu*"mol/mol)"),
    x2 = "Måned",
    y2 = bquote(atop(CO[2]*"-andel i tørr luft ("*mu*"mol/mol)",
                     "Avvik fra årlig gjennomsnitt")),
    title2 = "Årlig variasjon"
  ),

  pl_PL = list(
    locale_lc_time = "pl_PL.UTF-8",
    title = bquote("Średnie miesięczne stężenie"~CO[2]),
    subtitle = "Mauna Loa",
    caption_scripps = paste("Dane : R. F. Keeling, S. J. Walker, S. C. Piper i A. F. Bollenbacher\nScripps CO2 Program (https://scrippsco2.ucsd.edu/). Dostęp na", Sys.Date()),
    caption_noaa = paste("Dane : Dr. Pieter Tans, NOAA/ESRL (https://gml.noaa.gov/ccgg/trends/) i\nDr. Ralph Keeling, Scripps Institution of Oceanography (https://scrippsco2.ucsd.edu/). Dostęp na", Sys.Date()),
    x = "Rok",
    y = bquote("Frakcja"~CO[2]~"w suchym powietrzu ("*mu*"mol/mol)"),
    x2 = "Miesiąc",
    y2 = bquote(atop("Frakcja"~CO[2]~"w suchym powietrzu ("*mu*"mol/mol)", "Odejście od średniej rocznej")),
    title2 = "Wahania sezonowe"
  ),

  ro_RO = list(
    locale_lc_time = "ro_RO.UTF-8",
    title = bquote("Concentrația medie lunară de"~CO[2]),
    subtitle = "Mauna Loa, Hawaii",
    caption_scripps = paste("Date: R. F. Keeling, S. J. Walker, S. C. Piper și A. F. Bollenbacher\nScripps CO2 Program (https://scrippsco2.ucsd.edu/). Accesat în", Sys.Date()),
    caption_noaa = paste("Date : Dr. Pieter Tans, NOAA/ESRL (https://gml.noaa.gov/ccgg/trends/) și\n Dr. Ralph Keeling, Scripps Institution of Oceanography (https://scrippsco2.ucsd.edu/). Accesat în", Sys.Date()),
    x = "An",
    y = bquote("Ponderea"~CO[2]~"în aer uscat ("*mu*"mol/mol)"),
    x2 = "Lună",
    y2 = bquote(atop("Abaterea cotei"~CO[2]~"în aer uscat ("*mu*"mol/mol)", "Abatere de la media anuală")),
    title2 = "Variație sezonieră"
  ),

  ru_RU = list(
    locale_lc_time = "ru_RU.UTF-8",
    title = bquote("Среднемесячная и среднегодовая концентрации"~CO[2]),
    subtitle = "Мауна Лоа, Гаваи",
    caption_scripps = paste("данные : R. F. Keeling, S. J. Walker, S. C. Piper и A. F. Bollenbacher\nScripps CO2 Program (https://scrippsco2.ucsd.edu/). доступ на", Sys.Date()),
    caption_noaa = paste("данные : Dr. Pieter Tans, NOAA/ESRL (https://gml.noaa.gov/ccgg/trends/) и\nDr. Ralph Keeling, Scripps Institution of Oceanography (https://scrippsco2.ucsd.edu/). доступ на ", Sys.Date()),
    x = "Годы",
    y = bquote("Доля"~CO[2]~"в сухом воздухе ("*mu*"mol/mol)"),
    x2 = "Месяцы",
    y2 = bquote(atop("Отклонение доли"~CO[2]~"в сухом воздухе", "от среднегодового значения, мкмоль/моль")),
    title2 = "Сезонные колебания"
  )

)


# Data --------------------------------------------------------------------

# First try NOAA data, if not availble use Scripps data
if (!http_error("ftp://aftp.cmdl.noaa.gov/products/trends/co2/co2_mm_mlo.txt")) {
  # https://gml.noaa.gov/ccgg/trends/data.html
  source <- "noaa"
  co2ml <- read_table(
    "ftp://aftp.cmdl.noaa.gov/products/trends/co2/co2_mm_mlo.txt",
    col_names = c("year", "month", "decimal", "average", "deseason", "ndays", "stddays", "unc"),
    col_types = "iidddidd",
    na = c("-99.99", "-1"),
    comment = "#") %>%
    group_by(year) %>%
    mutate(year_mean = mean(average, na.rm = TRUE),
           delta = average - year_mean,
           vdate = ymd(paste0("2015-", month, "-01")))%>%
    rename(co2 = average)

} else {
  # https://scrippsco2.ucsd.edu/data/atmospheric_co2/primary_mlo_co2_record
  # used during US gov shutdown
  source <- "scripps"
  co2ml <- read_csv(
    "https://scrippsco2.ucsd.edu/assets/data/atmospheric/stations/in_situ_co2/monthly/monthly_in_situ_co2_mlo.csv",
    col_names = c("year", "month", "xls_date", "decimal",
                  "co2_raw", "co2_raw_seas_adj", "fit", "fit_seas_adj",
                  "co2_filled", "co2_filled_seas_adj"),
    col_types = "iiiddddddd",
    skip = 57,
    na = "-99.99",
    comment = "\"") %>%
    group_by(year) %>%
    mutate(year_mean = mean(co2_filled, na.rm = TRUE),
           delta = co2_filled - year_mean,
           vdate = ymd(paste0("2015-", month, "-01"))) %>%
    rename(co2 = co2_filled)
}


# Generate the plot for each language -------------------------------------

for (l in names(language)) {
  message(l)
  current <- language[[l]]

  # format the date in local names
  Sys.setlocale("LC_TIME", current$locale_lc_time)

  # main plot
  p1 <- ggplot(co2ml, aes(decimal, co2)) +
    geom_line(color = "pink") +
    geom_point(color = "red", size = 0.6) +
    stat_smooth(span = 0.1) +
    scale_x_continuous(breaks = pretty_breaks()) +
    scale_y_continuous(breaks = pretty_breaks()) +
    labs(x = current$x,
         y = current$y,
         title = current$title,
         subtitle = paste(current$subtitle, min(co2ml$year), "-", max(co2ml$year)),
         caption = paste(current[[paste0("caption_", source)]],
                         "https://w.wiki/4ZWn", sep = "\n")) +
    theme_bw() +
    theme(plot.caption = element_text(size = 7))

  # inset plot
  p2 <- ggplot(co2ml, aes(vdate, delta)) +
    geom_hline(yintercept = 0) +
    stat_smooth(span = 0.4, se = FALSE) +
    stat_summary(fun.data = "mean_cl_boot", colour = "red", size = 0.3) +
    scale_x_date(breaks = pretty_breaks(4),
                 minor_breaks = pretty_breaks(12),
                 labels = date_format("%b")) +
    labs(x = current$x2,
         y = current$y2,
         title = current$title2) +
    theme_bw()

  # merge the plots and export in SVG
  p1 + annotation_custom(grob = ggplotGrob(p2),
                         xmin = 1957, xmax = 1991, ymin = 361, ymax = 420)

  ggsave(file = paste("co2_mauna_loa", l, Sys.Date(), "wp.svg", sep = "_"),
         width = 20,
         height = 20,
         units = "cm",
         device = svg)
}

# return to former locale
Sys.setlocale("LC_TIME", old_locale)
File history
Click on a date/time to view the file as it appeared at that time.
| Date/Time | Thumbnail | Dimensions | User | Comment | |
|---|---|---|---|---|---|
| current | 19:48, 15 December 2023 | | 708 × 708 (438 KB) | Oeneis (talk | contribs) | update 2023 |
| 17:31, 22 December 2022 |  | 708 × 708 (432 KB) | Oeneis (talk | contribs) | 2022 update | |
| 08:29, 15 August 2022 |  | 708 × 708 (432 KB) | Oeneis (talk | contribs) | update with 2022 data | |
| 21:59, 16 December 2021 |  | 708 × 708 (428 KB) | Oeneis (talk | contribs) | update URLs | |
| 19:43, 16 December 2021 |  | 708 × 708 (425 KB) | Oeneis (talk | contribs) | 2021 data | |
| 19:35, 31 October 2020 |  | 708 × 708 (424 KB) | Oeneis (talk | contribs) | Update data 2020-10-31 | |
| 14:44, 20 July 2019 |  | 708 × 708 (414 KB) | Oeneis (talk | contribs) | data up to 2019-06 | |
| 11:11, 6 January 2019 |  | 708 × 708 (411 KB) | Oeneis (talk | contribs) | 2018 Datei | |
| 13:52, 20 January 2018 |  | 708 × 708 (380 KB) | Oeneis (talk | contribs) | 1958-2017 data | |
| 15:12, 8 October 2017 |  | 708 × 708 (379 KB) | Oeneis (talk | contribs) | typo |
You cannot overwrite this file.
File usage on Commons
The following 30 pages use this file:
- User:Hgrobe/klimawandel
- User:Holly Cheng/Recent uploads/Hawaii/2016 January 5
- User:Holly Cheng/Recent uploads/Hawaii/2017 January 20
- User:Holly Cheng/Recent uploads/Hawaii/2017 October 8
- User:Holly Cheng/Recent uploads/Hawaii/2018 January 20
- User:Holly Cheng/Recent uploads/Hawaii/2019 January 6
- User:Holly Cheng/Recent uploads/Hawaii/2019 July 20
- User:Holly Cheng/Recent uploads/Hawaii/2020 October 31
- User:Holly Cheng/Recent uploads/Hawaii/2021 December 16
- User:Holly Cheng/Recent uploads/Hawaii/2022 August 15
- User:Holly Cheng/Recent uploads/Hawaii/2022 December 22
- User:Holly Cheng/Recent uploads/Hawaii/2023 December 15
- User:Klimafix
- User:Magog the Ogre/Multilingual legend/2020 October 21-31
- User:Magog the Ogre/Multilingual legend/2021 December 11-20
- User:Magog the Ogre/Multilingual legend/2022 August 11-20
- User:Magog the Ogre/Multilingual legend/2022 December 21-31
- User:Magog the Ogre/Multilingual legend/2023 December 13-16
- File:Mauna Loa CO2 monthly mean concentration-ca.svg
- File:Mauna Loa CO2 monthly mean concentration-es.svg
- File:Mauna Loa CO2 monthly mean concentration.svg
- File:Mauna Loa CO2 monthly mean concentrationCS.svg
- File:Mauna Loa CO2 monthly mean concentration DE.svg
- File:Mauna Loa CO2 monthly mean concentration FR.svg
- File:Mauna Loa CO2 monthly mean concentration NL.svg
- File:Mauna Loa CO2 monthly mean concentration NO.svg
- File:Mauna Loa CO2 monthly mean concentration PL.svg
- File:Mauna Loa CO2 monthly mean concentration RO.svg
- File:Mauna Loa CO2 monthly mean concentration RU.svg
- Template:Other versions/Mauna Loa CO2 monthly mean concentration
File usage on other wikis
The following other wikis use this file:
- Usage on de.wikipedia.org
- Klimawandelleugnung
- Kohlenstoffdioxid
- Charles David Keeling
- Roger Revelle
- Messstation Mauna Loa
- Keeling-Kurve
- CO2-Budget
- EU-Emissionshandel
- CO2-Steuer
- Losing Earth
- Wikipedia Diskussion:Hauptseite/Artikel des Tages/Archiv/Vorschläge/2019/Q4
- Benutzer:Klimafix
- Wikipedia Diskussion:Hauptseite/Artikel des Tages/Archiv/Vorschläge/2020/Q3
- Wikipedia:Hauptseite/Archiv/25. September 2020
- Wikipedia Diskussion:Hauptseite/Jahrestage/Archiv/2023
- Usage on de.wiktionary.org
- Usage on www.wikidata.org