File:Mauna Loa Carbon Dioxide-da.svg

Size of this PNG preview of this SVG file: 800 × 515 pixels. Other resolutions: 320 × 206 pixels | 640 × 412 pixels | 1,024 × 659 pixels | 1,280 × 824 pixels | 2,560 × 1,647 pixels | 850 × 547 pixels.
Original file (SVG file, nominally 850 × 547 pixels, file size: 27 KB)
Captions
Captions
Add a one-line explanation of what this file represents
Summary edit
| Description |
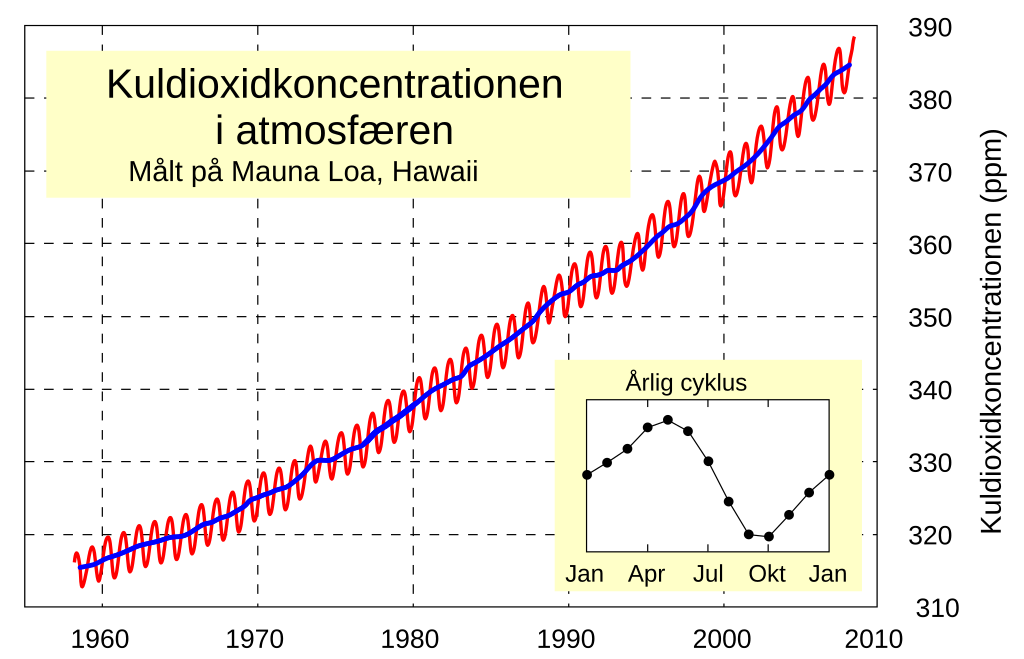
Nederlands: Op deze grafiek wordt de evolutie weergegeven van de koolstofdioxideconcentraties van de atmosfeer , zoals die gemeten werden op Mauna Loa, Hawaii. Deze curve staat bekend als de Keeling curve . De curve wordt beschouwd als een bewijs van stijging van broeikasgassen door menselijke invloeden, die gelinkt worden aan een mogelijke opwarming van de aarde. De metingen op Mauna Loa zijn de langstlopende metingen hieromtrent, maar de gegevens worden ook door andere metingen elders op de wereld bevestigd[1]. In de inzet staat de jaarlijkse fluctuatie in koolstofdioxide, die wordt veroorzaakt door de wisseling van de seizoenen. Op het noordelijk halfrond komen meer bossen voor dan op het zuidelijk halfrond. Daardoor wordt er meer koolstofdioxide opgenomen door landplanten tijdens de zomer op het noordelijk halfrond. Deze jaarlijks cyclus wordt hier berekend door de gemiddelde concentratie van elke maand te berekenen, gemeten over alle jaren heen. De rode curve volgt de maandgemiddelden, en de blauwe curve volgt de jaargemiddelden. English: This figure shows the history of atmospheric carbon dioxide concentrations as directly measured at Mauna Loa, Hawaii. This curve is known as the Keeling curve, and is an essential piece of evidence of the man-made increases in greenhouse gases that are believed to be the cause of global warming. The longest such record exists at Mauna Loa, but these measurements have been independently confirmed at many other sites around the world [2]. The annual fluctuation in carbon dioxide is caused by seasonal variations in carbon dioxide uptake by land plants. Since many more forests are concentrated in the Northern Hemisphere, more carbon dioxide is removed from the atmosphere during Northern Hemisphere summer than Southern Hemisphere summer. This annual cycle is shown in the inset figure by taking the average concentration for each month across all measured years. The grey curve shows the average monthly concentrations, and red curve is a moving 12 month average. |
| Date | (UTC) |
| Source |
This file was derived from: Mauna Loa Carbon Dioxide-nl.svg: |
| Author |
|
| This is a retouched picture, which means that it has been digitally altered from its original version. The original can be viewed here: Mauna Loa Carbon Dioxide-nl.svg:
|
Licensing edit
I, the copyright holder of this work, hereby publish it under the following licenses:
This file is licensed under the Creative Commons Attribution-Share Alike 3.0 Unported, 2.5 Generic, 2.0 Generic and 1.0 Generic license.
- You are free:
- to share – to copy, distribute and transmit the work
- to remix – to adapt the work
- Under the following conditions:
- attribution – You must give appropriate credit, provide a link to the license, and indicate if changes were made. You may do so in any reasonable manner, but not in any way that suggests the licensor endorses you or your use.
- share alike – If you remix, transform, or build upon the material, you must distribute your contributions under the same or compatible license as the original.

|
Permission is granted to copy, distribute and/or modify this document under the terms of the GNU Free Documentation License, Version 1.2 or any later version published by the Free Software Foundation; with no Invariant Sections, no Front-Cover Texts, and no Back-Cover Texts. A copy of the license is included in the section entitled GNU Free Documentation License. |
You may select the license of your choice.
Original upload log edit
This image is a derivative work of the following images:
- File:Mauna Loa Carbon Dioxide-nl.svg licensed with Cc-by-sa-3.0,2.5,2.0,1.0, GFDL
- 2011-02-13T00:15:20Z Pirumbaut 850x547 (27994 Bytes) Fixed black box, second try
- 2011-02-13T00:08:23Z Pirumbaut 850x547 (27898 Bytes) Fixed black box
- 2011-02-12T23:59:06Z Pirumbaut 850x547 (27902 Bytes) Fixed problem with subscript.
- 2011-02-12T23:52:31Z Pirumbaut 850x547 (27382 Bytes) {{Information |Description={{nl|Op deze grafiek wordt de evolutie weergegeven van de [[w:koolstofdioxide|koolstofdioxide]]concentraties van de [[w:aardatmosfeer|atmosfeer]] , zoals die gemeten werden op [[w:Mauna Loa|Mauna Lo
Uploaded with derivativeFX
File history
Click on a date/time to view the file as it appeared at that time.
| Date/Time | Thumbnail | Dimensions | User | Comment | |
|---|---|---|---|---|---|
| current | 19:06, 25 April 2020 | | 850 × 547 (27 KB) | Brinchj (talk | contribs) | == {{int:filedesc}} == {{Information |Description={{nl|Op deze grafiek wordt de evolutie weergegeven van de koolstofdioxideconcentraties van de atmosfeer , zoals die gemeten werden op Mauna Loa, Hawaii. Deze curve staat bekend als de Keeling curve . De curve wordt beschouwd als een bewijs van stijging van broeikasgassen door menselijke invloeden, die gelinkt worden aan een... |
You cannot overwrite this file.
File usage on Commons
The following 2 pages use this file:
File usage on other wikis
The following other wikis use this file:
- Usage on da.wikipedia.org