File:Median and Average Sales Prices of New Homes Sold in United States Monthly from 1999-2009.png
Size of this preview: 800 × 383 pixels. Other resolutions: 320 × 153 pixels | 640 × 306 pixels | 1,024 × 490 pixels | 2,136 × 1,022 pixels.
Original file (2,136 × 1,022 pixels, file size: 22 KB, MIME type: image/png)
Captions
Captions
Add a one-line explanation of what this file represents
Summary edit
| Description |
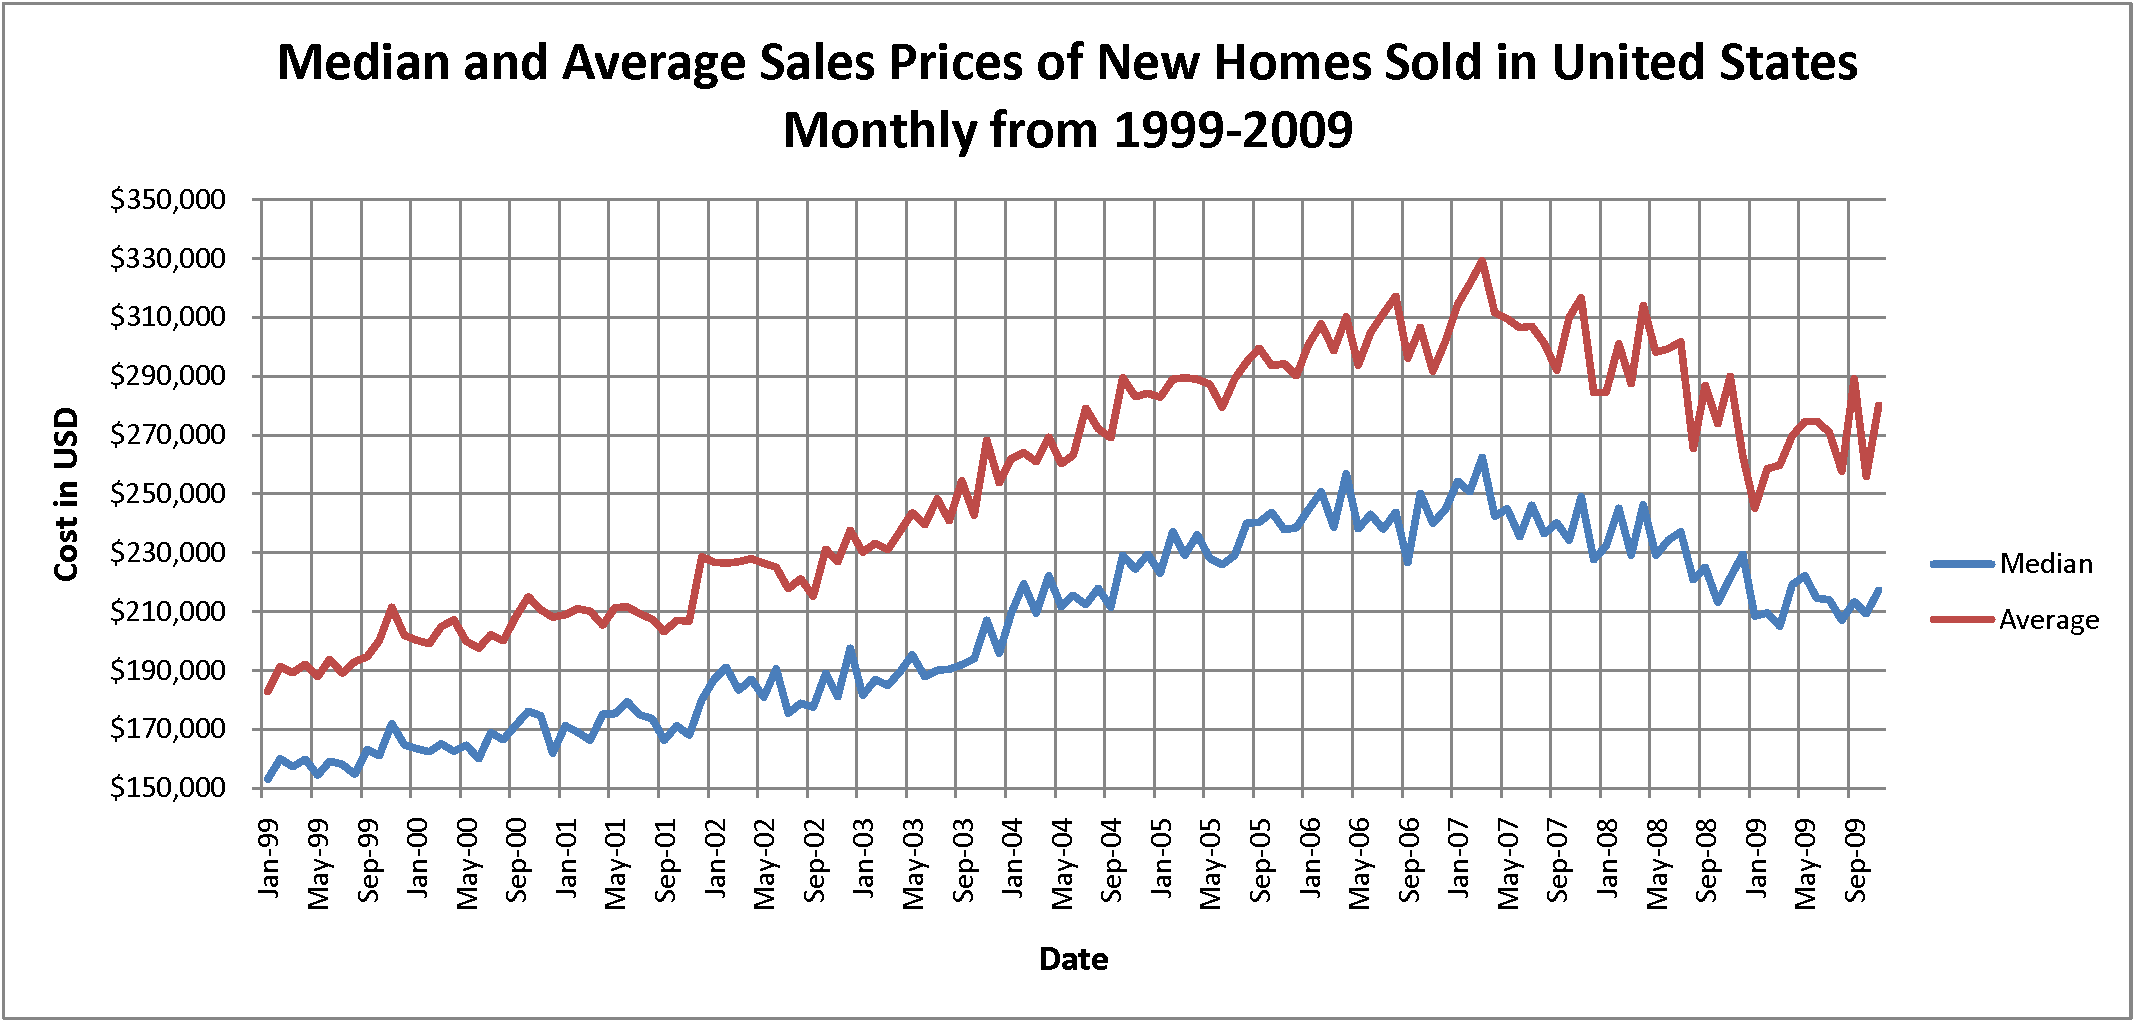
English: A graph showing the "Median and Average Sales Prices of New Homes Sold in United States". It shows the monthly data from 1999 through 2009. It should be noted that the sales price includes the land. This graph is made using the data from. The graph was made in excel. |
| Date | (UTC) |
| Source | I (Smallman12q (talk)) created this graph based on the tables provided by the US Census Bureau at https://www.census.gov\/const/uspricemon.pdf Graph file |
| Author | Smallman12q (talk) |
| Other versions | File:Median_and_Average_Sales_Prices_of_New_Homes_Sold_in_United_States_Monthly_from_1999-2009.pdf |
The data is as follows:
| Date | Median | Average |
| Jan-99 | $153,100 | $182,900 |
| Feb-99 | $160,000 | $191,400 |
| Mar-99 | $157,300 | $189,300 |
| Apr-99 | $159,900 | $192,200 |
| May-99 | $154,400 | $187,900 |
| Jun-99 | $159,300 | $193,900 |
| Jul-99 | $158,200 | $189,100 |
| Aug-99 | $154,800 | $193,100 |
| Sep-99 | $163,200 | $194,800 |
| Oct-99 | $161,100 | $200,200 |
| Nov-99 | $172,000 | $211,500 |
| Dec-99 | $164,800 | $202,100 |
| Jan-00 | $163,500 | $200,300 |
| Feb-00 | $162,400 | $199,200 |
| Mar-00 | $165,100 | $204,900 |
| Apr-00 | $162,600 | $207,300 |
| May-00 | $164,700 | $200,000 |
| Jun-00 | $160,100 | $197,700 |
| Jul-00 | $169,000 | $202,200 |
| Aug-00 | $166,600 | $200,200 |
| Sep-00 | $171,500 | $208,300 |
| Oct-00 | $176,300 | $215,100 |
| Nov-00 | $174,700 | $210,700 |
| Dec-00 | $162,000 | $208,100 |
| Jan-01 | $171,300 | $209,000 |
| Feb-01 | $169,100 | $211,000 |
| Mar-01 | $166,300 | $210,200 |
| Apr-01 | $175,200 | $205,500 |
| May-01 | $175,300 | $211,400 |
| Jun-01 | $179,400 | $211,700 |
| Jul-01 | $175,000 | $209,300 |
| Aug-01 | $173,700 | $207,500 |
| Sep-01 | $166,400 | $203,300 |
| Oct-01 | $171,300 | $207,100 |
| Nov-01 | $168,100 | $206,900 |
| Dec-01 | $180,200 | $228,700 |
| Jan-02 | $187,100 | $226,900 |
| Feb-02 | $191,100 | $226,500 |
| Mar-02 | $183,400 | $227,100 |
| Apr-02 | $187,100 | $228,100 |
| May-02 | $181,000 | $226,500 |
| Jun-02 | $190,600 | $225,200 |
| Jul-02 | $175,600 | $217,800 |
| Aug-02 | $178,900 | $221,300 |
| Sep-02 | $177,500 | $215,300 |
| Oct-02 | $189,200 | $231,300 |
| Nov-02 | $181,200 | $227,100 |
| Dec-02 | $197,600 | $237,800 |
| Jan-03 | $181,700 | $230,200 |
| Feb-03 | $187,000 | $233,400 |
| Mar-03 | $185,100 | $231,100 |
| Apr-03 | $189,500 | $237,200 |
| May-03 | $195,500 | $243,700 |
| Jun-03 | $187,900 | $239,700 |
| Jul-03 | $190,200 | $248,400 |
| Aug-03 | $190,500 | $241,000 |
| Sep-03 | $192,000 | $254,500 |
| Oct-03 | $194,100 | $242,800 |
| Nov-03 | $207,100 | $268,300 |
| Dec-03 | $196,000 | $253,900 |
| Jan-04 | $209,500 | $262,100 |
| Feb-04 | $219,600 | $264,100 |
| Mar-04 | $209,600 | $261,000 |
| Apr-04 | $222,300 | $269,300 |
| May-04 | $211,700 | $260,400 |
| Jun-04 | $215,700 | $263,200 |
| Jul-04 | $212,400 | $279,200 |
| Aug-04 | $218,100 | $272,200 |
| Sep-04 | $211,600 | $269,200 |
| Oct-04 | $229,200 | $289,600 |
| Nov-04 | $224,500 | $283,200 |
| Dec-04 | $229,600 | $284,300 |
| Jan-05 | $223,100 | $283,000 |
| Feb-05 | $237,300 | $289,100 |
| Mar-05 | $229,300 | $289,600 |
| Apr-05 | $236,300 | $289,100 |
| May-05 | $228,300 | $287,400 |
| Jun-05 | $226,100 | $279,600 |
| Jul-05 | $229,200 | $289,300 |
| Aug-05 | $240,100 | $295,000 |
| Sep-05 | $240,400 | $299,600 |
| Oct-05 | $243,900 | $293,600 |
| Nov-05 | $237,900 | $294,400 |
| Dec-05 | $238,600 | $290,200 |
| Jan-06 | $244,900 | $301,000 |
| Feb-06 | $250,800 | $307,900 |
| Mar-06 | $238,800 | $298,800 |
| Apr-06 | $257,000 | $310,300 |
| May-06 | $238,200 | $293,900 |
| Jun-06 | $243,200 | $305,000 |
| Jul-06 | $238,100 | $311,300 |
| Aug-06 | $243,900 | $317,300 |
| Sep-06 | $226,700 | $296,200 |
| Oct-06 | $250,400 | $306,800 |
| Nov-06 | $240,100 | $291,800 |
| Dec-06 | $244,700 | $301,900 |
| Jan-07 | $254,400 | $314,600 |
| Feb-07 | $250,800 | $321,500 |
| Mar-07 | $262,600 | $329,400 |
| Apr-07 | $242,500 | $311,700 |
| May-07 | $245,000 | $309,700 |
| Jun-07 | $235,500 | $306,500 |
| Jul-07 | $246,200 | $307,100 |
| Aug-07 | $236,500 | $301,300 |
| Sep-07 | $240,300 | $292,200 |
| Oct-07 | $234,300 | $310,100 |
| Nov-07 | $249,100 | $316,800 |
| Dec-07 | $227,700 | $284,400 |
| Jan-08 | $232,400 | $284,600 |
| Feb-08 | $245,300 | $301,200 |
| Mar-08 | $229,300 | $287,600 |
| Apr-08 | $246,400 | $314,300 |
| May-08 | $229,300 | $298,200 |
| Jun-08 | $234,300 | $299,400 |
| Jul-08 | $237,300 | $301,900 |
| Aug-08 | $221,000 | $265,500 |
| Sep-08 | $225,200 | $287,100 |
| Oct-08 | $213,200 | $274,000 |
| Nov-08 | $221,600 | $290,100 |
| Dec-08 | $229,600 | $263,100 |
| Jan-09 | $208,600 | $245,200 |
| Feb-09 | $209,700 | $258,600 |
| Mar-09 | $205,100 | $259,800 |
| Apr-09 | $219,200 | $269,800 |
| May-09 | $222,300 | $274,600 |
| Jun-09 | $214,700 | $274,800 |
| Jul-09 | $214,200 | $271,100 |
| Aug-09 | $207,100 | $257,800 |
| Sep-09 | $213,500 | $289,200 |
| Oct-09 | $209,400 | $255,900 |
| Nov-09 | $217,400 | $280,300 |
Licensing edit
| This work has been released into the public domain by its author, Smallman12q. This applies worldwide. In some countries this may not be legally possible; if so: |
Original upload log edit
Transferred from en.wikipedia to Commons using FtCG.
The original description page was here. All following user names refer to en.wikipedia.
| Date/Time | Dimensions | User | Comment |
|---|---|---|---|
| 14:50, 12 October 2011 | 2,136 × 1,022 (22,953 bytes) | w:en:Smallman12q (talk | contribs) | (Wrong chart) |
| 14:45, 12 October 2011 | 1,066 × 557 (54,228 bytes) | w:en:Smallman12q (talk | contribs) | (Updated) |
| 13:48, 5 January 2010 | 2,136 × 1,022 (22,953 bytes) | w:en:Smallman12q (talk | contribs) | ({{Information |Description = A graph showing the "Median and Average Sales Prices of New Homes Sold in United States". It shows the monthly data from 1999 through 2009. It should be noted that the sales price includes the land. This graph is made usin) |
File history
Click on a date/time to view the file as it appeared at that time.
| Date/Time | Thumbnail | Dimensions | User | Comment | |
|---|---|---|---|---|---|
| current | 01:14, 10 June 2012 | | 2,136 × 1,022 (22 KB) | This is also Sven Manguard (talk | contribs) | Transferred from en.wikipedia: see original upload log above |
You cannot overwrite this file.
File usage on Commons
There are no pages that use this file.
File usage on other wikis
The following other wikis use this file:
- Usage on en.wikipedia.org