File:NASA-global-warming-map-1970-79-to-2000-09.jpg

Size of this preview: 513 × 599 pixels. Other resolutions: 206 × 240 pixels | 411 × 480 pixels | 753 × 879 pixels.
Original file (753 × 879 pixels, file size: 288 KB, MIME type: image/jpeg)
Captions
Captions
Add a one-line explanation of what this file represents
Summary edit
| Description |
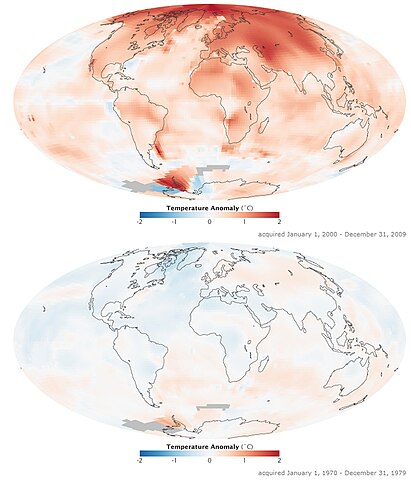
English: This image shows the difference in average surface temperatures from 1970-79 (bottom) to 2000-09 (top) due to global warming. Both maps show temperature anomalies, not absolute temperature. Anomalies refer to the average temperature as of 1951-1980.
Deutsch: Dieses Bild zeigt den Unterschied zwischen der weltweiten bodennahen Lufttemperatur im Zeitraum 1970-70 (unten) zu den Jahren 2000-09 (oben) auf Grund der globalen Erwärmung. Dargestellt sind jeweils Anomalien, keine absoluten Temperaturen, gegenüber dem Standardzeitraum von 1951-1980. |
| Date | |
| Source | http://earthobservatory.nasa.gov/IOTD/view.php?id=47628 |
| Author | NASA |
Licensing edit
| This file is in the public domain in the United States because it was solely created by NASA. NASA copyright policy states that "NASA material is not protected by copyright unless noted". (See Template:PD-USGov, NASA copyright policy page or JPL Image Use Policy.) | ||
 |
Warnings:
|
File history
Click on a date/time to view the file as it appeared at that time.
| Date/Time | Thumbnail | Dimensions | User | Comment | |
|---|---|---|---|---|---|
| current | 09:35, 27 January 2011 | | 753 × 879 (288 KB) | Nils Simon (talk | contribs) | {{Information |Description ={{en|1=This image shows the difference in average surface temperatures from 1970-70 (bottom) to 2000-09 (top) due to global warming.}} {{de|1=Dieses Bild zeigt den Unterschied zwischen der weltweiten bodennahen Lufttemperatu |
You cannot overwrite this file.
File usage on Commons
There are no pages that use this file.
File usage on other wikis
The following other wikis use this file:
- Usage on de.wikipedia.org
- Usage on en.wikipedia.org
- Usage on fi.wikipedia.org
- Usage on frr.wikipedia.org
- Usage on fr.wikipedia.org