File:Partial melting asthenosphere EN.svg

Size of this PNG preview of this SVG file: 800 × 480 pixels. Other resolutions: 320 × 192 pixels | 1,024 × 614 pixels | 1,280 × 768 pixels | 2,560 × 1,536 pixels.
Original file (SVG file, nominally 1,000 × 600 pixels, file size: 92 KB)
Captions
Captions
Add a one-line explanation of what this file represents
Summary edit
| Description |
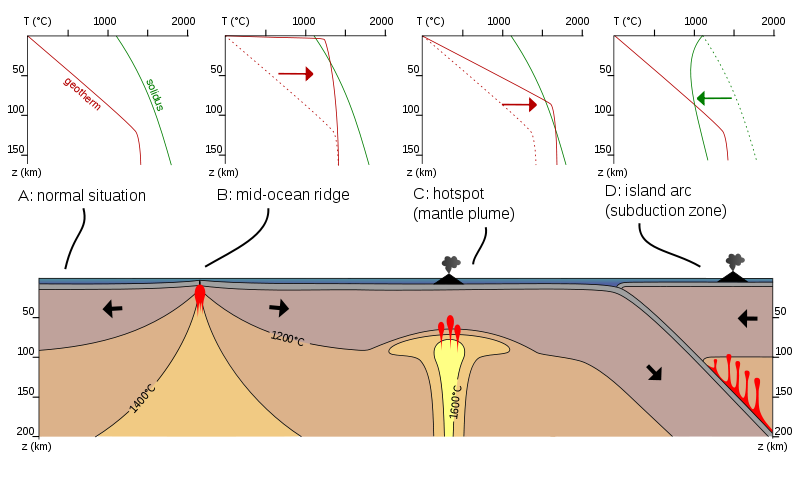
English: Schematic diagram showing the physical processes within the Earth’s upper mantle that lead to the generation of magma. A to D are different plate tectonic settings. The graphs show the geotherm (temperature curve inside the Earth, red) and the solidus (temperature where rock starts to melt, green). When the two curves cross each other, magma is generated by partial melting. A) the curves do not cross - no magma is generated B) at mid-ocean ridges magma generation occurs at quite shallow depths due to high temperatures and very thin lithosphere C) over mantle plumes magma generation occurs at larger depths due to even higher temperatures but thicker lithosphere D) over subducting slabs magma generation occurs at larger depths due to lowering of melting temperature of the rock by fluids released from the slab |
| Date | |
| Source | Own work |
| Author | Woudloper |
| Other versions |
File:Partial melting asthenosphere DE.svg (German) File:Partial melting asthenosphere ES.svg (Spanish) File:Partial melting asthenosphere FR.svg (French) File:Partial melting asthenosphere NL.svg (Dutch) File:Partial melting asthenosphere PL.svg (Polish) |
Licensing edit
I, the copyright holder of this work, hereby publish it under the following licenses:

|
Permission is granted to copy, distribute and/or modify this document under the terms of the GNU Free Documentation License, Version 1.2 or any later version published by the Free Software Foundation; with no Invariant Sections, no Front-Cover Texts, and no Back-Cover Texts. A copy of the license is included in the section entitled GNU Free Documentation License. |
This file is licensed under the Creative Commons Attribution-Share Alike 3.0 Unported, 2.5 Generic, 2.0 Generic and 1.0 Generic license.
- You are free:
- to share – to copy, distribute and transmit the work
- to remix – to adapt the work
- Under the following conditions:
- attribution – You must give appropriate credit, provide a link to the license, and indicate if changes were made. You may do so in any reasonable manner, but not in any way that suggests the licensor endorses you or your use.
- share alike – If you remix, transform, or build upon the material, you must distribute your contributions under the same or compatible license as the original.
You may select the license of your choice.
File history
Click on a date/time to view the file as it appeared at that time.
| Date/Time | Thumbnail | Dimensions | User | Comment | |
|---|---|---|---|---|---|
| current | 06:55, 26 May 2010 | | 1,000 × 600 (92 KB) | Woudloper (talk | contribs) | {{Information |Description={{en|1=Schematic diagram showing the fysical processes inside the Earth that lead to the generation of magma. A to D are different plate tectonic settings. The graphs show the [[:w:Geothermal gradient|geot |
You cannot overwrite this file.
File usage on Commons
The following page uses this file:
File usage on other wikis
The following other wikis use this file:
- Usage on bg.wikipedia.org
- Usage on en.wikipedia.org
- Usage on et.wikipedia.org
- Usage on ja.wikipedia.org
- Usage on mk.wikipedia.org
- Usage on sl.wikipedia.org
- Usage on sr.wikipedia.org
- Usage on uk.wikipedia.org
- Usage on vi.wikipedia.org